Safety, Rehabilitation and Compensation Act 1988
Section 28
INSTRUMENT OF APPROVAL
I, Christopher Evans, Minister for Tertiary Education, Skills, Jobs and Workplace Relations, under subsection 28(3) of the Safety, Rehabilitation and Compensation Act 1988 (‘the Act’) approve, with effect on and from 1 December 2011:
(a) the revocation of the Safety, Rehabilitation and Compensation Act 1988 – Guide to the Assessment of the Degree of Permanent Impairment (‘Edition 2 of the Guide’) prepared by Comcare under subsection 28(1) of the Act on 1 September 2005 and approved by the Minister for Employment and Workplace Relations on 8 September 2005; and
NOTE: Edition 2 of the Guide is registered on the Federal Register of Legislative Instruments as F2005L02586.
(b) the attached Guide to the Assessment of the Degree of Permanent Impairment (Edition 2.1 of the Guide’) prepared by Comcare under subsection 28(1) of the Act on 6 September 2011.
Dated: 2 November 2011
[signed]
Christopher Evans
Minister for Tertiary Education, Skills, Jobs and Workplace Relations
guide to the assessment of the degree of permanent impairment
Edition 2.1
Introduction to Edition 2.1 of the Guide
1. Authority
2. Structure of this guide
3. Application of this guide
4. Whole person impairment (WPI)
5. Entitlements under the SRC Act
6. Non-economic loss
7. Compensation Payable
8. Interim and final assessments
9. Increase in degree of whole person impairment
Contents
List of tables and figures
List of tables and figures
List of tables and figures
List of tables and figures
List of references
Principles of assessment
1. Impairment and non-economic loss
2. Employability and incapacity
3. Permanent impairment
4. Pre-existing conditions and aggravation
5. The impairment tables
6. Malignancies and conditions resulting in major systemic failure
7. Percentages of impairment
8. Comparing assessments under alternative tables
9. Combined values
10. Calculating the assessment
11. Ordering of additional investigations
12. Exceptions to use of Part 1 of this guide
Glossary
Division 1
Assessment of the degree of an employee’s
permanent impairment resulting from an injury
1.0 Introduction
1.1 Coronary artery disease
1.2 Hypertension
1.2.1 Diastolic hypertension
1.2.2 Systolic hypertension
1.3 Arrhythmias
1.4 Peripheral vascular disease of the lower extremities
1.5 Peripheral vascular disease of the upper extremities
1.6 Raynaud’s disease
2.0 Introduction
2.1 Assessing impairment of respiratory function
2.1.1 Measurements
2.1.2 Methods of measurement
2.1.3 Impairment rating
2.2 Asthma and other hyper-reactive airways diseases
2.3 Lung cancer and mesothelioma
2.4 Breathing disorders associated with sleep
3.0 Introduction
3.1 Thyroid and parathyroid glands
3.2 Adrenal cortex and medulla
3.3 Pancreas (diabetes mellitus)
3.4 Gonads and mammary glands
4.0 Introduction
4.1 Skin disorders
4.2 Facial disfigurement
4.3 Bodily disfigurement
5.0 Introduction
5.1 Psychiatric conditions
6.3 Abnormal ocular motility and binocular diplopia
6.0 Introduction
6.1 Central visual acuity
6.1.1 Determining the loss of central vision in one eye
6.2 Determining loss of monocular visual fields
6.3 Abnormal ocular motility and binocular diplopia
6.4 Other ocular abnormalities
6.5 Other conditions involving permanent deformities causing up to 10% impairment of the whole person
6.6 Calculation of visual system impairment for both eyes
Figure 6-F: Calculation of Visual System Impairment for Both Eyes
7.0 Introduction
7.1 Hearing loss
7.2 Tinnitus
7.3 Olfaction and taste
7.4 Speech
7.5 Air passage defects
7.6 Nasal passage defects
7.7 Chewing and swallowing
8.0 Introduction
8.1 Upper digestive tract—oesophagus, stomach, duodenum, small intestine and pancreas
8.2 Lower gastrointestinal tract—colon and rectum
8.3 Lower gastrointestinal tract—anus
8.4 Surgically created stomas
8.5 Liver—chronic hepatitis and parenchymal liver disease
8.6 Biliary tract
8.7 Hernias of the abdominal wall
9.0 Introduction
Part I—Introduction
9.1 Feet and toes
9.2 Ankles
9.3 Knees
9.4 Hips
9.5 Lower extremity amputations
9.6 Spinal nerve root impairments and peripheral nerve injuries affecting the lower extremities
9.6.1 Spinal nerve root impairment affecting the lower extremity
9.6.2 Peripheral nerve injuries affecting the lower extremities
9.11 Shoulders
Part III—Introduction
Part III—Definitions of clinical findings for diagnosis-related estimates in assessing spinal impairment
Part III—Multi-level fractures involving the spinal canal
9.15 Cervical spine—diagnosis-related estimates
9.16 Thoracic spine—diagnosis-related estimates
9.17 Lumbar spine—diagnosis-related estimates
Notes to Table 9.17
9.18 Fractures of the pelvis
10.0 Introduction
10.1 The Upper Urinary Tract
11.0 Introduction
11.1 Male reproductive system
11.1.1 Male reproductive organs—penis
11.1.2 Male reproductive organs—scrotum
11.1.3 Male reproductive organs—testes, epididymes and spermatic cords
11.1.4 Male reproductive organs—prostate and seminal vesicles
11.2 Female reproductive system
11.2.1 Female reproductive organs—vulva and vagina
11.2.2 Female reproductive organs—cervix and uterus
11.2.3 Female reproductive organs—fallopian tubes and ovaries
12.0 Introduction
12.1 Disturbances of levels of consciousness and awareness
12.1.1 Permanent disturbances of levels of consciousness and awareness
12.1.2 Epilepsy, seizures and convulsive disorders
12.1.3 Sleep and arousal disorders
12.2 Impairment of memory, learning, abstract reasoning and problem solving ability
12.3 Communication impairments—dysphasia and aphasia
12.4 Emotional or behavioural impairments
12.5 Cranial nerves
12.5.1 The olfactory nerve (I)
12.5.2 The optic nerve, the oculomotor and trochlear nerves and the abducens (II, III, IV and VI)
12.5.3 The trigeminal nerve (V)
12.5.4 The facial nerve (VII)
12.5.5 The auditory nerve (VIII)
12.5.6 The glossopharyngeal, vagus, spinal accessory and hypoglossal nerves (IX, X, XI and XII)
12.6 Neurological impairment of the respiratory system
12.7 Neurological impairment of the urinary system
12.8 Neurological impairment of the anorectal system
12.9 Neurological impairment affecting sexual function
13.0 Introduction
13.1 Anaemia
13.2 Leukocyte abnormalities or disease
13.3 Haemorrhagic disorders and platelet disorders
13.4: Thrombotic disorders
Division 2
Guide to the assessment of non-economic loss
Introduction
B1. Pain
B2. Suffering
B3. Loss of amenities
B4. Other loss
B5. Loss of expectation of life
B6. Calculation of non-economic loss
Division 3
Calculation of total entitlement under Section 24 and Section 27
Appendix 1
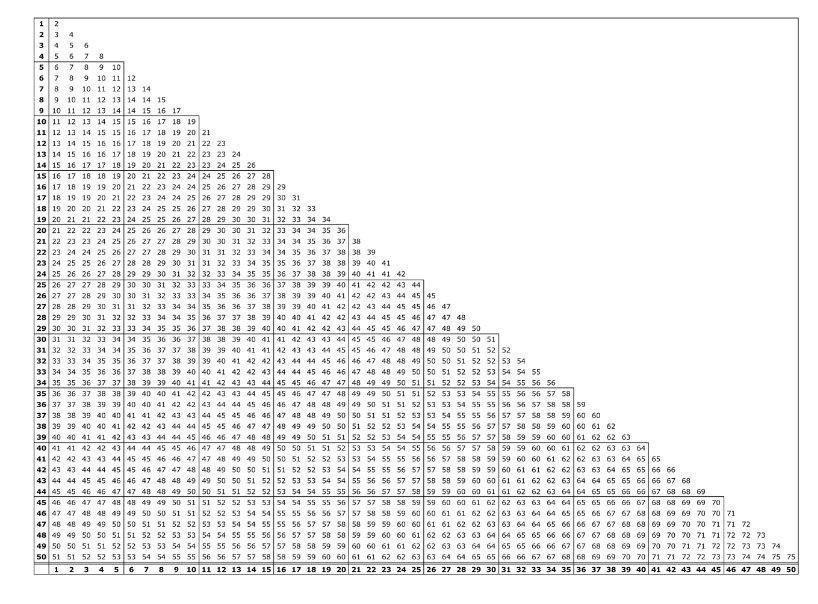
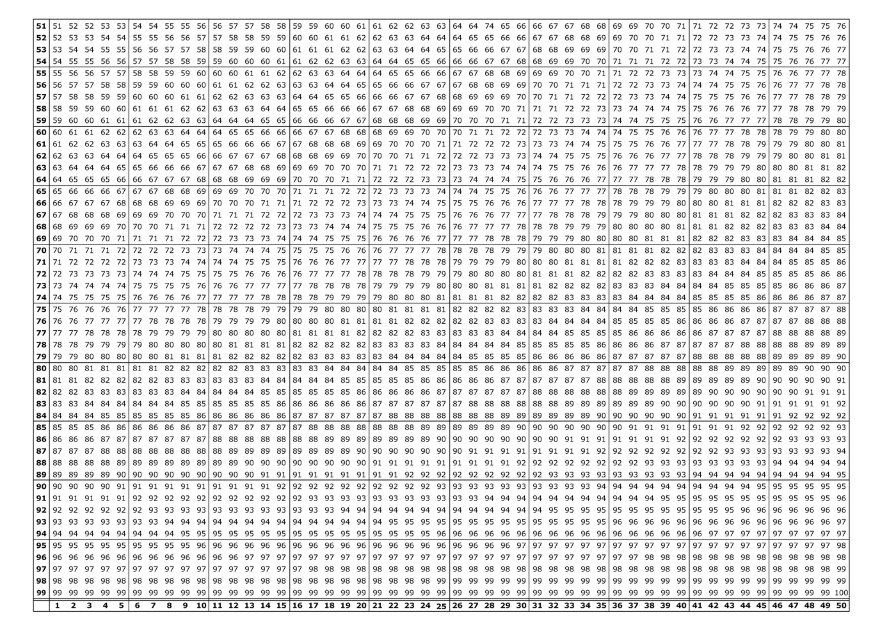
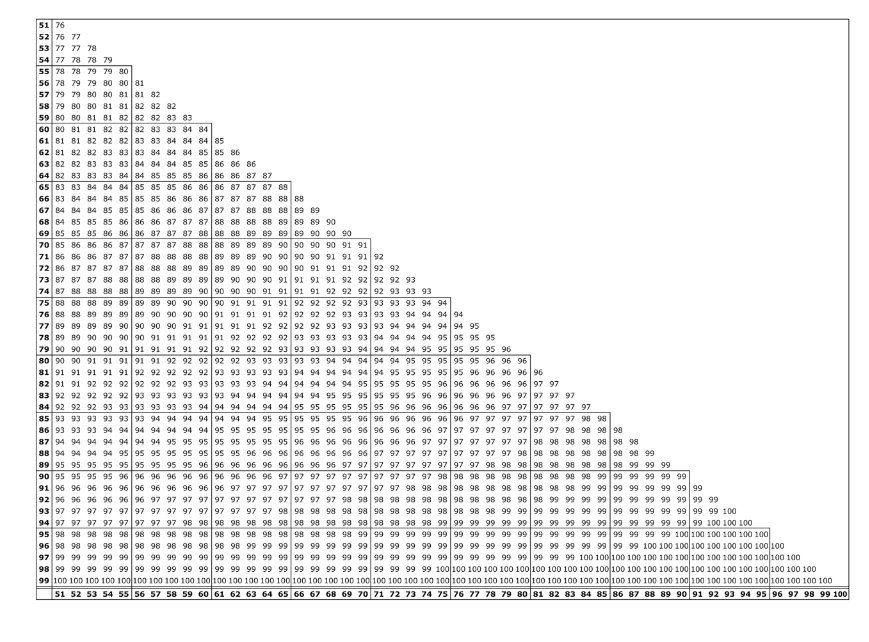
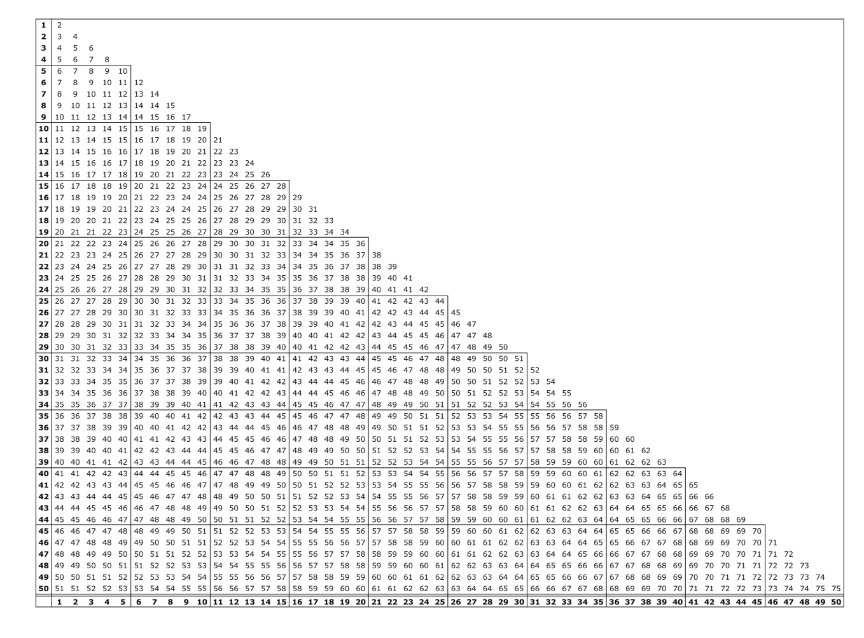
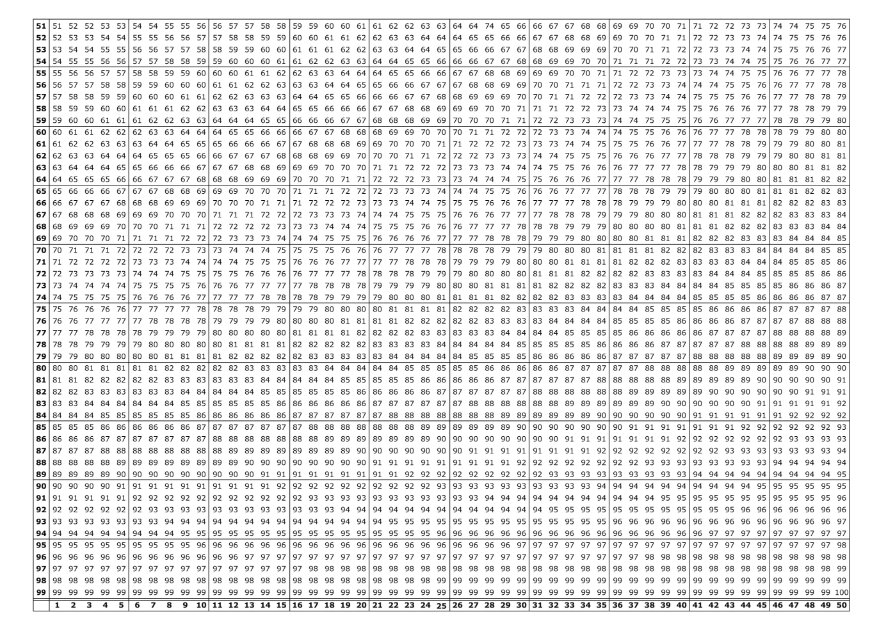
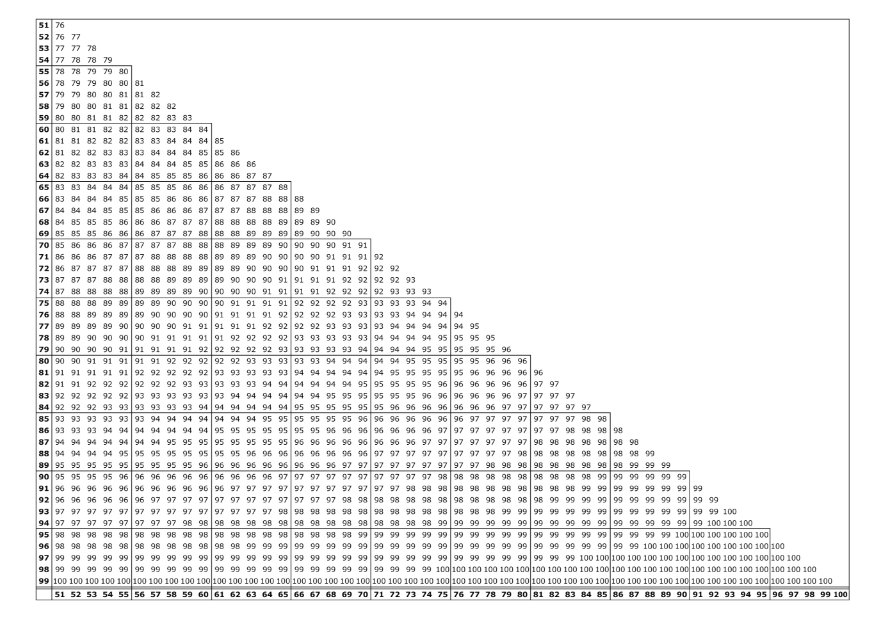
Combined values chart
Part 1 Appendix 1: Combined values chart
Contents
List of references
List of tables and figures
List of references
Principles of assessment
1. Impairment and non-economic loss
2. Employability and incapacity
3. Permanent
4. The impairment tables
5. Gradations of impairment
6. Combined impairments
7. Double assessment
8. Fingers and toes
9. Inapplicability of Part 2 of this guide
10. Interim assessments
11. Application of Part 2 of the guide
12. Likelihood of reduction in degree of impairment
13. Aggravation
Glossary
Glossary (continued)
Division 1—Impairment
1. Cardio-vascular system
2. Respiratory system
3. Endocrine system
4. Skin disorders
Table 4.2: Facial disfigurement
5. Psychiatric conditions
6. Visual system
7. Ear, nose and throat disorders
8. Digestive system
9. Musculo-skeletal system
10. Urinary system
11. Reproductive system
12. Neurological function
13. Miscellaneous
Appendix 1
14. Combined values chart
Part 2—Appendix 1: Combined values chart
Division 2—Non-economic loss
Division 4 of Part II (sections 24 to 28) of the Commonwealth’s Safety, Rehabilitation and Compensation Act 1988 (the SRC Act) provides for payment of lump sum compensation for permanent impairment and non-economic loss resulting from a work related injury.
The amount of compensation payable (if any) is to be assessed by reference to the degree of permanent impairment and the degree of non-economic loss determined by Comcare under the provisions of the approved guide:
‘approved guide’ is defined by section 4 of the SRC Act as meaning:
(a) the document, prepared by Comcare in accordance with section 28 under the title ‘Guide to the Assessment of the Degree of Permanent Impairment’, that has been approved by the Minister and is for the time being in force; and
(b) if an instrument varying the document has been approved by the Minister—that document as so varied.
Authority for this document rests therefore in subsections 28(1), 28(2) and 28(3) of the SRC Act, which provide that:
(1) Comcare may, from time to time, prepare a written document, to be called the ‘Guide to the Assessment of the Degree of Permanent Impairment’, setting out:
(a) criteria by reference to which the degree of the permanent impairment of an
employee resulting from an injury shall be determined
(b) criteria by reference to which the degree of non-economic loss suffered by an
employee as a result of an injury or impairment shall be determined; and
(c) methods by which the degree of permanent impairment and the degree of non economic loss, as determined under those criteria, shall be expressed as a percentage.
(2) Comcare may, from time to time, by instrument in writing, vary or revoke the approved Guide.
(3) A document prepared by Comcare under subsection (1), and an instrument under subsection (2), have no force or effect unless and until approved by the Minister.
This document is the new Guide to the Assessment of the Degree of Permanent Impairment. It may be referred to as ‘this guide’ or ‘Edition 2.1 of the guide’. This guide is binding on Comcare, licensed authorities and corporations, and the Administrative Appeals Tribunal (subsection 29(4) of the SRC Act).
This guide is divided into two parts:
Part 1—Claims for Permanent Impairment other than Defence-related claims
This part deals with the assessment of claims other than defence-related claims as defined in Part XI of the SRC Act. That is, claims made under the SRC Act by employees who are not members of the Australian Defence Force.
Part 2—Defence-related claims for permanent impairment
This part deals with the assessment of defence-related claims as defined in Part XI of the SRC Act. That is, claims made under the SRC Act by members of the Australian Defence Force in relation to injuries which occurred during defence service before 1 July 2004.
The responsibility for development of any guide that applies to members of the Australian Defence Force in respect of injuries incurred after the commencement of the Military Rehabilitation and Compensation Act 2004 (MRC Act) will fall to the Military Rehabilitation and Compensation Commission (MRCC).
Part 1 of this guide has three divisions:
DIVISION 1—Division 1 is used to assess the degree of an employee’s permanent impairment resulting from an injury.
DIVISION 2—Division 2 is used to assess the degree of an employee’s non-economic loss resulting from impairment.
DIVISION 3—Division 3 is used to calculate the total entitlement based on the assessments completed in Divisions 1 and 2.
The Principles of Assessment and Glossary in Part 1 of this guide contain information relevant to the interpretation and application of Part 1, Divisions 1 and 2.
Part 2 of this guide has two divisions:
DIVISION 1—Division 1 is used to assess the degree of an employee’s permanent impairment resulting from an injury.
DIVISION 2—Division 2 is used to assess the degree of an employee’s non-economic loss resulting from impairment.
The Principles of Assessment and Glossary in Part 2 of this guide contain information relevant to the interpretation and application of Part 2, Divisions 1 and 2.
The Guide to the Assessment of the Degree of Permanent Impairment prepared by the Commission for the Safety, Rehabilitation and Compensation of Commonwealth Employees under subsection 28 (1) of the Commonwealth Employees’ Rehabilitation and Compensation Act 1988 and approved by the Minister of State for Industrial Relations by notice in writing dated 27 July 1989 is referred to as the ‘first edition of the guide’.
The first edition of the guide was revoked and the second edition of the guide applied in relation to determinations made under sections 24, 25 or 27 on and from 1 March 2006. Claims under those sections received on or before 28 February 2006 continue to be determined under the provisions of the first edition of the guide.
The second edition of the guide is revoked on and from 1 December 2011 and edition 2.1 of the guide applies from that date. This edition varies the second edition by addressing medical ambiguities identified by medical practitioners using the second edition of the guide, addressing various errata and providing a 10% impairment rating for all tables within the guide. Edition 2.1 of the guide does not change the structure of the second edition of the guide or the composition of benefits payable.
Except as provided below, Part 1 of Edition 2.1 of the guide applies to determinations made on and from 1 December 2011 under sections 24, 25 or 27 of the SRC Act in respect of claims under those sections received by the relevant authority after 28 February 2006.
Part 2 of this guide will apply on and from 1 December 2011 to determinations under sections 24, 25 or 27 of the SRC Act after 1 December 2011, in respect of defence-related claims received by the relevant authority after 28 February 2006 for injuries related to defence service rendered before 1 July 2004.
Where a request by an employee pursuant to subsection 25 (1) of the SRC Act (in respect of interim payment of permanent impairment compensation) is received by the relevant authority after 1 December 2011 but relates to a claim under section 24 that was received by the authority on or before the 28 February 2006, that request will be determined under the provisions of the first edition of the guide.
Where a request by an employee pursuant to subsection 25(1) of the SRC Act (in respect of interim payment of permanent impairment compensation) is received by the relevant authority after 1 December 2011 but relates to a claim under section 24 that was received by the authority between 28 February 2006 and 1 December 2011, that request will be determined under the provisions of the second edition of the guide.
Where a claim for compensation pursuant to subsections 25(4) or 25 (5) of the SRC Act (in respect of a subsequent increase in the degree of permanent impairment) is received by the relevant authority after 1 December 2011 that claim will be determined under the provisions of this guide, notwithstanding that the initial claim for compensation for permanent impairment may have been determined under the provisions of the previous editions of the guide.
However, where the initial claim for compensation for permanent impairment was determined under the provisions of the first or second edition of the Guide, in determining whether or not there has been any subsequent increase in the degree of permanent impairment under this guide, the degree of permanent impairment or the degree of non-economic loss shall not be less than the degree of permanent impairment or degree of non-economic loss determined under the provisions of the first or second edition of the guide unless that determination would not have been made but for a false statement or misrepresentation of a person.
In this guide, ‘relevant authority’ and ‘defence-related claims’ have the same meaning as defined in section 4 and Part XI of the SRC Act.
Prior to 1988, the Compensation (Commonwealth Government Employees) Act 1971 (repealed with the coming into effect of the SRC Act) provided for the payment of lump sum compensation where an employee suffered the loss of, or loss of efficient use of, a part of the body or faculty, as specified in a table of maims. The range of conditions compensated was exclusive and did not reflect the broad range of work-related injuries and diseases.
This guide, like the previous editions, is, for the purposes of expressing the degree of impairment as a percentage, based on the concept of ‘whole person impairment’. Subsection 24(5) of the SRC Act provides for the determination of the degree of permanent impairment of the employee resulting from an injury, that is, the employee as a whole person. The whole person impairment concept, therefore, provides for compensation for the permanent impairment of any body part, system or function to the extent to which it permanently impairs the employee as a whole person.
Whole person impairment is assessed under Division 1 of Parts 1 and 2 of this guide.
Where the degree of permanent impairment of the employee (other than a hearing loss) determined under subsection 24(5) of the SRC Act is less than 10 per cent, paragraph 24(7)(b) of the SRC Act provides that compensation is not payable to the employee under section 24 of that Act.
Subsection 24(8) of the SRC Act excludes the operation of subsection 24(7) in relation to impairment resulting from the loss, or the loss of the use, of a finger or toe, or the loss of the sense of taste or smell.
For injuries suffered by employees after 1 October 2001, subsection 24(7A) of the SRC Act provides that, if the injury results in a permanent impairment that is a hearing loss, the 10% threshold does not apply. In those cases, subsection 24(7A) provides that there is no compensation payable if the permanent impairment that is binaural hearing loss is less than 5%.
Subsection 27(1) of the SRC Act provides that where there is liability to pay compensation in respect of a permanent impairment, additional compensation for non-economic loss is payable in accordance with section 27.
Non-economic loss is assessed under Division 2 of Parts 1 and 2 of this guide.
The maximum level of payment is prescribed in the legislation and indexed annually on 1 July in accordance with the Consumer Price Index. Compensation is calculated at the rate applicable at the time of the assessment (In Part 1 of this guide, see Division 3 for calculation of total entitlement).
On the written request of the employee under subsection 25(1) of the SRC Act, an interim determination must be made of the degree of permanent impairment suffered and an assessment made of an amount of compensation payable to the employee, where:
- a determination has been made that an employee has suffered a permanent impairment as a result of an injury
- the degree of that impairment is equal to or more than 10%
- a final determination of the degree of permanent impairment has not been made.
When a final determination of the degree of permanent impairment is made, there is payable to the employee, under subsection 25(3) of the SRC Act, an amount equal to the difference, if any, between the final determination and the interim assessment.
Where a final assessment of the degree of permanent impairment has been made and the level of whole person permanent impairment subsequently increases by 10% or more in respect of the same injury, the employee may request, pursuant to subsection 25(4) of the SRC Act, another assessment for compensation for permanent impairment and non-economic loss. Additional compensation is payable for the increased level of impairment only.
For injuries suffered by employees after 1 October 2001, pursuant to subsection 25(5) of the SRC Act, if the injury results in a permanent impairment that is a hearing loss, there may be a further amount of compensation payable if there is a subsequent increase in the binaural hearing loss of 5% or more.
See section 3 above (Application of this guide) as to assessments of the degree of permanent impairment made under the previous editions of the guide.
Division 1—Assessment of degree and employee’s permanent impairment resulting from injury
Chapter 1—The cardiovascular system
Figure 1-A: Activities of daily living 31
Figure 1-B: Symptomatic level of activity in METS according to age and gender 32
Table 1.1: Coronary artery disease 33
Table 1.2.1: Diastolic hypertension 35
Table 1.2.2: Systolic hypertension 36
Figure 1-C: Definitions of functional class 37
Table 1.3: Arrhythmias 37
Table 1.4: Peripheral vascular disease of the lower extremities 38
Table 1.5: Peripheral vascular disease of the upper extremities 39
Figure 1-C: Definitions of functional class 40
Table 1.6: Raynaud’s disease 41
Chapter 2—The respiratory system
Table 2.1: Conversion of respiratory function values to impairment 45
Figure 2-A: Calculating asthma impairment score 47
Table 2.2: Whole person impairment derived from asthma impairment score 48
Figure 2-B: Calculating obstructive sleep apnoea score 49
Table 2.4: Whole person impairment derived from obstructive sleep apnoea score 50
Chapter 3—The endocrine system
Table 3.1: Thyroid and parathyroid glands 53
Table 3.2: Adrenal cortex and medulla 54
Table 3.3: Pancreas (diabetes mellitus) 56
Table 3.4: Gonads and mammary glands 57
Chapter 4—Disfigurement and skin disorders
Table 4.1: Skin disorders 60
Figure 4-A: Activities of daily living 61
Table 4.2: Facial disfigurement 62
Table 4.3: Bodily disfigurement 63
Chapter 5—Psychiatric conditions
Figure 5-A: Activities of daily living 65
Table 5.1: Psychiatric conditions 67
Chapter 6—The visual system
Figure 6-A: Steps for calculating impairment of the visual system 71
Table 6.1: Conversion of the visual system to whole person impairment rating 72
(continued)
Figure 6-B: Revised LogMar equivalent for different reading cards 73
Figure 6-C: Percentage loss of central vision in one eye 74
Figure 6-D: Normal extent of the visual field 75
Figure 6-E: Percentage loss of ocular motility of one eye in diplopia fields 76
Figure 6-F: Calculation of visual system impairment for both eyes 78
Chapter 7—Ear, nose and throat disorders
Table 7.2: Tinnitus 82
Table 7.3: Olfaction and taste 83
Table 7.4: Speech 84
Table 7.5: Air passage defects 85
Table 7.6: Nasal passage defects 86
Table 7.7: Chewing and swallowing 86
Chapter 8—The digestive system
Figure 8-A: Activities of daily living 88
Figure 8-B: Body Mass Index criteria 89
Table 8.1: Upper digestive tract—oesophagus, stomach, duodenum, small intestine and pancreas 90-91
Table 8.2: Lower gastrointestinal tract—colon and rectum 92-94
Table 8.3: Lower gastrointestinal tract—anus 95
Table 8.4: Surgically created stomas 96
Table 8.5: Liver—chronic hepatitis and parenchymal liver disease 97-98
Table 8.6: Biliary tract 99
Table 8.7: Hernias of the abdominal wall 100
Chapter 9—The musculoskeletal system
Figure 9-A: Activities of daily living 103
Figure 9-B: Tables of normal ranges of motion of joints 104-105
Table 9.1: Feet and toes 108-109
Table 9.2: Ankles 110-111
Table 9.3: Knees 112-113
Table 9.4: Hips 114-115
Table 9.5: Lower extremity amputations 117
Figure 9-C: Grading system 118
Table 9.6.1: Spinal nerve root impairment affecting the lower extremity 119
Table 9.6.2a: Sensory impairment due to peripheral nerve injuries affecting the lower extremities 120
Table 9.6.2b: Motor impairment due to peripheral nerve injuries affecting the lower extremities 121
Table 9.7: Lower extremity function 123-124
(continued)
Table 9.8.1a: Abnormal motion/ankylosis of the thumb—IP and MP joints 127
Table 9.8.1b: Radial abduction/adduction/ opposition of the thumb – abnormal motion/ankylosis 128
Table 9.8.1c: Abnormal motion/ankylosis of the fingers—index and middle fingers 129
Table 9.8.1d: Abnormal motion/ankylosis of the fingers—ring and little fingers 130
Table 9.8.2a: Sensory losses in the thumb 133
Table 9.8.2b: Sensory losses in the index and middle fingers 133
Table 9.8.2c: Sensory losses in the little finger 134
Table 9.8.2d: Sensory losses in the ring finger 134
Table 9.9.1a: Wrist flexion/extension 136
Table 9.9.1b: Radial and ulnar deviation of wrist joint 137
Table 9.10.1a: Elbow flexion/extension 139
Table 9.10.1b: Pronation and supination of forearm 140
Table 9.11.1a: Shoulder flexion/extension 142
Table 9.11.1b: Shoulder flexion/extension —internal/external rotation of shoulder 143
Table 9.11.1c: Abduction/adduction of shoulder 144
Table 9.12.1: Upper extremity amputations 145
Table 9.12.2: Amputation of digits 145
Figure 9-D: Grading system 147
Table 9.13.1: Cervical nerve root impairment 148-149
Table 9.13.2a: Specific nerve lesions affecting the upper extremities – sensory impairment 150
Table 9.13.2b: Specific nerve lesions affecting the upper extremities motor impairment 151
Figure 9-E: Diagnostic criteria for CRPS 153
Figure 9-F: Impairment grading for CRPS 154
Table 9.14: Upper extremity function 158-159
Table 9.15: Cervical spine—diagnosis-related estimates 164-165
Table 9.16: Thoracic spine—diagnosis-related estimates 167-168
Table 9.17: Lumbar spine—diagnosis-related estimates 170-171
Table 9.18: Fractures of the pelvis 172
Chapter 10—The urinary system
Table 10.1: The upper urinary tract 175
Table 10.2: Urinary diversion 176
Table 10.3: Lower urinary tract 178
Chapter 11—The reproductive system
Table 11.1.1: Male reproductive organs— penis 181
Table 11.1.2: Male reproductive organs— scrotum 181
(continued)
Table 11.1.3: Male reproductive organs—
testes, epididymes and
spermatic cords 182
Table 11.1.4: Male reproductive organs —prostate and seminal vesicles 183
Table 11.2.1: Female reproductive organs—vulva and vagina 185
Table 11.2.2: Female reproductive organs—cervix and uterus 186
Table 11.2.3: Female reproductive organs—fallopian tubes and ovaries 187
Chapter 12—The neurological system
Figure 12-A: Activities of daily living 190
Table 12.1.1: Permanent disturbances of levels of consciousness and awareness 191
Table 12.1.2: Epilepsy, seizures and convulsive disorders 192
Table 12.1.3: Sleep and arousal disorders 193
Table 12.2: Impairment of memory, learning, abstract reasoning and problem solving ability 195
Figure 12-B: Clinical dementia rating (CDR) 196-197
Table 12.3: Criteria for rating impairment due to Aphasia and Dysphasia 199
Table 12.4: Emotional or behavioural impairments 201
Table 12.5.1: The olfactory nerve (I) 202
Table 12.5.3: The trigeminal nerve (V) 203
Table 12.5.4: The facial nerve (VII) 204
Table 12.5.5: The auditory nerve (VIII) 205
Figure 12-C: % WPI modifiers for episodic conditions 206
Table 12.5.6: The glossopharyngeal, vagus, spinal accessory and hypoglossal nerves (IX, X, XI and XII) 208
Table 12.6: Neurological impairment of the respiratory system 208
Table 12.7: Neurological impairment of the urinary system 209
Table 12.8: Neurological impairment of the anorectal system 209
Table 12.9: Neurological impairment affecting sexual function 210
Chapter 13—The haematopoietic system
Table 13.1: Anaemia 212
Figure 13-A: Activities of daily living 214
Table 13.2: Leukocyte abnormalities or disease 215
Table 13.3: Haemorrhagic disorders and platelet disorders 216
Table 13.4: Thrombotic disorders 217
Division 2—Guide to the Assessment of Non-Economic Loss
Table B1: Pain 219
Table B2: Suffering 220
Table B3.1: Mobility 221
Table B3.2: Social relationships 223
Table B3.3: Recreation and leisure activities 223
Table B4: Other loss 224
Table B5: Loss of expectation of life 225
B6: Worksheet calculation of non-economic loss 226-227
Division 3—Final calculation of entitlements under Section 24 and Section 25
C1: Worksheet final calculation of entitlements 228
Appendices
Appendix 1: Combined values chart 230-232
Abramson MJ et al, 1996, Aust NZ J Med, 26, 697-701.
American Academy of Sleep Medicine, 1999, ‘Sleep related breathing disorders in adults: Recommendations for syndrome definition and measurement techniques in clinical research’, 1999, Sleep, 22, 667-689.
American Medical Association, 1995, Guides to the Evaluation of Permanent Impairment, 4th edition, Chicago: American Medical Association.
American Medical Association, 2001, Guides to the Evaluation of Permanent Impairment, 5th edition, Chicago: American Medical Association.
American Thoracic Society Ad Hoc Committee on Impairment/Disability Criteria, 1986, ‘Evaluation of impairment/disability secondary to respiratory disorders’, Am Rev Respir Dis, 133, 1205-09
American Thoracic Society, 1993, ‘Guidelines for the evaluation of impairment/disability in patients with asthma’, Am Rev Respir Dis, 147, 1056-61.
Cummings J, Mega M, Gary K, Rosenberg-Thompson S, Carusi D, Gornbein J, ‘The neuropsychiatric inventory: comprehensive assessment of psychopathology in dementia’, Neurology, 1994, 44, 2308-2314.
Ensalada LH, ‘Complex regional pain syndrome’, in Brigham CR, ed, The Guides Casebook, Chicago, Ill: American Medical Association, 1999, 14.
Johns MW, 1991, ‘A new method for measuring daytime sleepiness: the Epworth sleepiness scale’, Sleep, 14, 540-5.
Morris JC, 1993, ‘The Clinical Dementia Rating (CDR): current version and scoring rules’, Neurology, 43(11), 2412-2414.
National Asthma Council, 2002, Asthma Management Handbook 2002, 5th edition, Melbourne: National Asthma Council of Australia.
1. Impairment and non-economic loss
2. Employability and incapacity
3. Permanent impairment
4. Pre-existing conditions and aggravation
5. The impairment tables
6. Malignancies and conditions resulting in major systemic failure
7. Percentages of impairment
8. Comparing assessments under alternative tables
9. Combined values
10. Calculating the assessment
11. Ordering of additional investigations
12. Exceptions to use of Part 1 of this guide
Under subsection 4(1) of the SRC Act, impairment means ‘the loss, the loss of the use, or the damage or malfunction, of any part of the body or of any bodily system or function or part of such system or function’. It relates to the health status of an individual and includes anatomical loss, anatomical abnormality, physiological abnormality, and psychological abnormality. The degree of impairment is assessed by reference to the impact of that loss by reference to the functional capacities of a normal healthy person.
Non-economic loss is assessed in accordance with Part 1, Division 2 (see page 221) of this guide, and deals with the effects of the impairment on the employee’s life. Under subsection 4(1) of the SRC Act, for an employee who has suffered an injury resulting in a permanent impairment, it means:
‘loss or damage of a non-economic kind suffered by the employee (including pain and suffering, a loss of expectation of life or a loss of the amenities or enjoyment of life) as a result of that injury or impairment and of which the employee is aware’.
Non-economic loss may be characterised as the ‘lifestyle effects’ of an impairment. ‘Lifestyle effects’ are a measure of an individual’s mobility and enjoyment of, and participation in, social relationships, and recreation and leisure activities. The employee must be aware of the losses suffered. While employees may have equal ratings of whole person impairment it would not be unusual for them to receive different ratings for non-economic loss because of their different lifestyles.
The concepts of ‘employability’ and ‘incapacity’ are not the tests for the assessment of impairment and non-economic loss. Incapacity is influenced by factors other than the degree of impairment and is compensated by weekly payments which are separate and independent to permanent impairment entitlements.
Compensation is only payable for impairments which are permanent. Under subsection 4(1) of the SRC Act ‘permanent’ means ‘likely to continue indefinitely’. Subsection 24(2) of the SRC Act provides that for the purposes of determining whether an impairment is permanent, the following matters shall be considered:
(a) the duration of the impairment
(b) the likelihood of improvement in the employee’s condition
(c) whether the employee has undertaken all reasonable rehabilitative treatment for the
impairment
(d) any other relevant matters.
Thus, a loss, loss of the use, damage, or malfunction, will be permanent if it is likely, in some degree, to continue indefinitely. For this purpose, regard shall be had to any medical opinion concerning the nature and effect (including possible effect) of the impairment, and the extent, if any, to which it may reasonably be capable of being reduced or removed.
Where a pre-existing or underlying condition is aggravated by a work-related injury, only the impairment resulting from the aggravation is to be assessed. However, an assessment should not be made unless the effects of the aggravation of the underlying or pre-existing condition are considered permanent. In these situations, the pre-existing or underlying condition would usually have been symptomatic prior to the work-related injury and the degree of permanent impairment resulting from that condition is able to be accurately assessed.
If the employee’s impairment is entirely attributable to the pre-existing or underlying condition, or to the natural progression of such a condition, the assessment for permanent impairment is nil.
Where the pre-existing or underlying condition was previously asymptomatic, all the permanent impairment arising from the work-related injury is compensable.
Part 1, Division 1 of this guide is based on the concept of whole person impairment which is drawn from the American Medical Association’s Guides to the Evaluation of Permanent Impairment 5th edition 2001.
Division 1 assembles into groups, according to body system, detailed descriptions of impairments. The extent of each impairment is expressed as a percentage value of the whole, normal, healthy person. Thus, a percentage value can be assigned to an employee’s impairment by reference to the relevant description in this guide.
It may be necessary in some cases to have regard to a number of chapters within Part 1 of this guide when assessing the degree of whole person impairment which results from compensable injury.
Where a table specifies a degree of impairment because of a surgical procedure, the same degree of impairment applies if the same loss of function has occurred due to a different medical procedure or treatment.
Conditions such as cancer, HIV infection, diabetes, asbestosis, mesothelioma and others, often with terminal consequences, may result in failure or impairment of multiple body parts or systems.
Assessments should be made of the impairment suffered in each of the affected body parts and systems and combined using the combined values chart in Part 1, Appendix 1.
Most tables in Part 1, Division 1 provide impairment values expressed as fixed percentages. Where such a table is applicable in respect of a particular impairment, there is no discretion to choose an impairment value not specified in that table. For example, where 10% and 20% are the specified values, there is no discretion to determine the degree of impairment as 15%.
Where a table provides for impairment values within a range, consideration will need to be given to all criteria applicable to the condition, which includes performing activities of daily living and an estimate of the degree to which the medical impairment interferes with these activities. In some cases, additional information may be required to determine where to place an individual within the range. The person conducting the assessment must provide written reason why he or she considers the selected point within the range as clinically justifiable.
For further information relating to the application of this guide, please contact the Comcare Permanent Impairment Guide Helpdesk on 1300 366 979 or email PI.Guide@comcare.gov.au.
Unless there are instructions to the contrary, where two or more tables (or combinations of tables) are equally applicable to an impairment, the decision-maker must assess the degree of permanent impairment under the table or tables which yields or yield the most favourable result to the employee.
Impairment is system or function based. A single injury may give rise to multiple losses of function and, therefore, multiple impairments. When more than one table applies in respect of that injury, separate scores should be allocated to each functional impairment. To obtain the whole person impairment in respect of that injury, those scores are then combined using the combined values chart (see Part 1, Appendix 1) unless the notes in the relevant section specifically stipulate that the scores are to be added. (For instance, see table 9.8.1).
Where there is an initial injury (or pre-existing condition) which results in impairment, and a second injury which results in impairment to the same bodily part, system or function the pre-existing impairment must be disregarded when assessing the degree of impairment of the second injury. The second injury should be assessed by reference to the functional capacities of a normal healthy person. The final scores are then added together.
Where two or more injuries give rise to different whole person impairments, each injury is to be assessed separately and the final scores for each injury (including any combined score for a particular injury) added together.
It is important to note that whenever the notes in the relevant section refer to combined ratings, the combined values chart must be used, even if no reference is made to the use of that chart.
Where relevant, a statement is included in the chapters of Part 1, Division 1 which indicates:
- the manner in which tables within that chapter may (or may not) be combined
- whether an assessment made in that chapter can be combined with an assessment made in another chapter in assessing the degree of whole person impairment.
There are some special circumstances where addition of scores rather than combination is required. These circumstances are specified in the relevant sections and tables in Part 1 of this guide.
As a general principle, the assessing medical practitioner should not order additional radiographic or other investigations solely for impairment evaluation purposes, unless the investigations are specifically required in the relevant chapter of Part 1 of this guide.
In the event that an employee’s impairment is of a kind that cannot be assessed in accordance with the provisions of Part 1 of this guide, the assessment is to be made under the American Medical Association’s Guides to the Evaluation of Permanent Impairment 5th edition 2001.
An assessment is not to be made using the American Medical Association’s Guides to the Evaluation of Permanent Impairment for:
- mental and behavioural impairments (psychiatric conditions)
- impairments of the visual system
- hearing impairment
- chronic pain conditions, except in the case of migraine or tension headaches. (For complex regional pain syndromes affecting the upper extremities, see Part 1, Chapter 9 – 9.13.3 Complex Regional Pain Syndrome).
Any reference in this guide to the American Medical Association’s Guides to the Evaluation of Permanent Impairment is a reference to the 5th edition 2001.
Definitions in italics are from subsection 4(1) and 5A(1) and 5B(1) of the SRC Act.
Activities of daily living are those activities that an employee needs to perform to function in a non-specific environment (that is, to live). Performance of Activities of Daily Living is measured by reference to primary biological and psychosocial function.
Ailment means any physical or mental ailment, disorder, defect or morbid condition (whether of sudden onset or gradual development).
Disease means:
(a) an ailment suffered by an employee
(b) an aggravation of such an ailment
that was contributed to, to a significant degree, by the employee’s employment by the Commonwealth or a licensee.
Impairment means the loss, the loss of the use, or the damage or malfunction, of any part of the body or of any bodily system or function or part of such system or function.
Injury means:
(a) a disease suffered by an employee
(b) an injury (other than a disease) suffered by an employee, that is a physical or mental injury arising out of, or in the course of, the employee’s employment
(c) an aggravation of a physical or mental injury (other than a disease) suffered by an employee (whether or not that injury arose out of, or in the course of, the employee’s employment), that is an aggravation that arose out of, or in the course of, that employment
but does not include a disease, injury or aggravation suffered as a result of reasonable administrative action taken in a reasonable manner in respect of the employee’s employment.
Loss of amenities means the effects on mobility, social relationships and recreation and leisure activities.
Non-economic loss in relation to an employee who has suffered an injury resulting in a permanent impairment, means loss or damage of a non-economic kind suffered by the employee (including pain and suffering, a loss of expectation of life or a loss of the amenities or enjoyment of life) as a result of that injury or impairment and of which the employee is aware.
Pain means physical pain.
Suffering means the mental distress resulting from the accepted conditions or impairment.
Whole person impairment (or WPI) is the methodology used for expressing the degree of impairment of a person, resulting from an injury, as a percentage. WPI is based on the American Medical Association’s Guides to the Evaluation of Permanent Impairment. WPI is a medical quantification of the nature and extent of the effect of an injury or disease on a person’s functional capacity including Activities of Daily Living. This guide presents descriptions of impairments in chapters and tables according to body system. The extent of each impairment is expressed as a percentage value of the functional capacity of a normal healthy person.
1.0 Introduction
1.1 Coronary artery disease
1.2 Hypertension
1.2.1 Diastolic hypertension
1.2.2 Systolic hypertension
1.3 Arrhythmias
1.4 Peripheral vascular disease of the lower extremities
1.5 Peripheral vascular disease of the upper extremities
1.6 Raynaud’s disease
In conducting an assessment, the assessor must have regard to the principles of assessment (see pages 23-26) and the definitions contained in the glossary (see pages 27-28).
WPI ratings derived from tables in this chapter may be combined with WPI ratings from other tables where there is co-existent disease (for example, cardiomyopathy, ischaemic heart disease, congenital heart disease, valvular heart disease).
‘Activities of daily living’ are activities which an employee needs to perform to function in a non-specific environment (that is, to live). Performance of activities of daily living is measured by reference to primary biological and psychosocial function.
For the purposes of Chapter 1, activities of daily living are those in Figure 1-A (see below).
Figure 1-A: Activities of daily living
Activity | Examples |
Self care, personal hygiene | Bathing, grooming, dressing, eating, eliminating. |
Communication | Hearing, speaking, reading, writing, using keyboard. |
Physical activity | Standing, sitting, reclining, walking, stooping, squatting, kneeling, reaching, bending, twisting, leaning, carrying, lifting, pulling, pushing, climbing, exercising. |
Sensory function | Tactile feeling. |
Hand functions | Grasping, holding, pinching, percussive movements, sensory discrimination. |
Travel | Driving or travelling as a passenger. |
Sexual function | Participating in desired sexual activity. |
Sleep | Having a restful sleep pattern. |
Social and recreational | Participating in individual or group activities, sports activities, hobbies. |
Chapter 1 does not cover impairments arising from cardiomyopathy, congenital heart disease, valvular heart disease, and pericardial heart disease. Where relevant, the degree of impairment arising from these conditions should be assessed in accordance with the appropriate table from the American Medical Association’s Guides to the Evaluation of Permanent Impairment 5th edition 2001.
For post-thrombotic syndrome, assessments under Tables 1.4 and 1.5 (peripheral vascular disease, see page 26) are an alternative to Table 13.4: Thrombotic Disorders (see Chapter 13 – The Haematopoietic System). WPI ratings from Tables 1.4 and 1.5 must not be combined with a WPI rating from Table 13.4. Tables 1.4 and 1.5 should be used as the primary guide for assessing peripheral complications of thrombosis.
Employees who have permanent cardiac limitation secondary to massive pulmonary embolism should be assessed under Chapter 1. A WPI rating assessed in these circumstances may not be combined with a rating from Table 13.4.
Steps for assessment are as follows.
Step 1 | Using Figure 1-B (see below), determine the symptomatic level of activity in METS according to age and gender. Figure 1-B may be used to assess conditions affecting left ventricular function (LVF) (including ischaemic heart disease, rheumatic heart disease, and hypertension). |
Step 2 | Using Table 1.1 (see below), refer to any one of pathology (column 3), drug therapy (column 4), or intervention (column 5), to identify the degree of impairment within the range of impairments for that symptomatic level of activity. |
Figure 1-B (see below) may be used for the assessment of symptomatic impairment caused by ischaemic heart disease, hypertension, cardiomyopathy, or rheumatic heart disease.
Figure 1-B: Symptomatic level of activity in METS according to age and gender
Age and gender | Symptomatic level of activity in METS |
1 | 1-2 | 2-3 | 3-4 | 4-5 | 5-6 | 6-7 | 7-8 | 8-9 | 10+ |
18-30 M | D | D | D | C | C | B | B | B | A | A |
18-30 F | D | D | C | C | B | B | A | A | A | |
31-40 M | D | D | D | C | C | B | B | A | A | |
31-40 F | D | D | C | B | B | B | A | | | |
41-50 M | D | D | C | C | B | B | A | A | | |
41-50 F | D | D | C | B | B | A | A | | | |
51-60 M | D | D | C | B | B | A | A | A | | |
51-60 F | D | D | C | B | B | A | A | | | |
61-70 M | D | D | C | B | B | A | A | | | |
61-70 F | D | D | B | B | A | A | | | | |
70+ M | D | C | B | B | A | | | | | |
70+ F | D | C | B | A | A | | | | | |
Table 1.1: Coronary artery disease
See notes immediately following Table 1.1 for further details regarding abbreviations and symbols used in columns 3, 4 and 5.
Column 1 % WPI | Column 2 Level of activity in METS for age and gender | Column 3 Pathology | Column 4 Drug therapy | Column 5 Intervention |
5 | A | Not applicable | Not applicable | Not applicable |
10 | A | + | + | Not applicable |
15 | A | ++ | ++ | PTCA |
20 | A | +++ | +++ | CABG/Tx |
25 | B | + | + | Not applicable |
30 | B | ++ | ++ | PTCA |
40 | B | +++ | +++ | CABG/Tx |
50 | C | + | + | Not applicable |
60 | C | ++ | ++ | PTCA |
65 | C | +++ | +++ | CABG/Tx |
75 | D | + | + | Not applicable |
85 | D | ++ | ++ | PTCA |
95 | D | +++ | +++ | CABG/Tx |
Notes to Table 1.1
- In Table 1.1, not applicable means the criterion is not applicable to the specified level of impairment.
- Pathology—column 3.
(i) Coronary artery disease:
+ either <50% stenosis in one or more coronary arteries, or single vessel disease > 50% stenosis (except proximal left anterior descending [LAD] and left main coronary artery [LMCA])
++ either >50% stenosis in two vessels, or >50% stenosis in proximal LAD, or <50% stenosis in LMCA
+++ either >50% stenosis in 3 vessels, or LMCA >50% stenosis, or severe diffuse end organ disease.
(ii) Ischaemic left ventricular dysfunction:
+ left ventricular ejection fraction (LVEF) 40-50%
++ LVEF 30-40%
+++ either LVEF < 30%, or LV aneurysm.
(iii) Myocardial infarction (MI):
+ no previous MI
++ previous possible MI (equivocal changes in ECG/cardiac enzymes)
+++ previous definite MI (unequivocal changes in ECG/cardiac enzymes: typical evolution of ST/T segments, or development of significant Q waves, or enzyme rise > 3 times upper limit of normal).
(iv) Arrhythmias
Assessed under Table 1.3—Arrhythmias (see page 38).
3. Drug therapy (continuous) —Column 4.
+ one or two drugs
++ three or four drugs
+++ five or more drugs.
4. Intervention—column 5.
PTCA means percutaneous transluminal coronary angioplasty and/or stenting.
CABG means coronary artery bypass grafting.
Tx means heart transplant.
Either diastolic hypertension (section 1.2.1 below) or systolic hypertension (section 1.2.2 on the following page) may be assessed, whichever provides the higher WPI rating.
Hypertensive cardiomyopathy can be assessed using the American Medical Association’s Guides to the Evaluation of Permanent Impairment 5th edition 2001.
Functional class (determined in accordance with Figure 1-B, see page 32) is the primary criterion for assessment. Level of diastolic blood pressure (DBP) and therapy (see Table 1.2.1 below) are secondary criteria for assessment.
For assessment use either usual DBP, or therapy, for a given functional class, whichever provides the greater WPI rating. If DBP is consistently >120 on optimal therapy, one higher functional class may be assigned.
Table 1.2.1: Diastolic hypertension
See note immediately following Table 1.2.1 for explanation of symbols used in the final column (drug therapy).
% WPI | Level of activity in METS for age and gender | Usual DBP | Drug therapy |
5 | A | >90 | + |
10 | A | >100 | ++ |
15 | A | >110 | +++ |
20 | B | >90 | + |
25 | B | >100 | ++ |
30 | B | >110 | +++ |
35 | C | >90 | + |
40 | C | >100 | ++ |
45 | C | >110 | +++ |
50 | D | >90 | + |
55 | D | >100 | ++ |
60 | D | >110 | +++ |
Note to Table 1.2.1
- Drug therapy (continuous)—final column of Table 1.2.1:
+ one drug
++ two drugs
+++ three or more drugs.
Hypertensive cardiomyopathy can be assessed using the American Medical Association’s Guides to the Evaluation of Permanent Impairment 5th edition 2001.
Functional class (determined in accordance with Figure 1-B, see page 32) is the primary criterion for assessment. Level of systolic blood pressure (SBP) and therapy (see Table 1.2.2 below) are secondary criteria for assessment.
Table 1.2.2: Systolic hypertension
See note immediately following Table 1.2.2 for explanation of symbols used in the final column (drug therapy).
% WPI | Symptomatic level of activity in METS for age and gender | Usual SBP | Drug therapy |
5 | A | >160 | + |
10 | A | >160 | ++ |
15 | A | >160 | +++ |
20 | B | >170 | + |
25 | B | >170 | ++ |
30 | B | >170 | +++ |
35 | C | >180 | + |
40 | C | >180 | ++ |
45 | C | >180 | +++ |
50 | D | >190 | + |
55 | D | >190 | ++ |
60 | D | >190 | +++ |
Note to Table 1.2.2
- Drug therapy (continuous):
+ one drug
++ two drugs
+++ three or more drugs.
Underlying cardiac disease can be assessed using other tables in Chapter 1.
Functional class (determined under Figure 1-C below), and therapy (see Table 1.3 below), are used to determine the WPI rating.
Figure 1-C: Definitions of functional class
Functional class | Symptoms |
I | No limitation of physical activity. |
II | Slight limitation of physical activity. Comfortable at rest and with ordinary, light Activities of Daily Living. Greater activity causes symptoms. |
III | Marked limitation of physical activity. Comfortable at rest. Ordinary activity causes symptoms. |
IV | Inability to carry out any physical activity without discomfort. |
Table 1.3: Arrhythmias
See note immediately following Table 1.3 for explanation of symbols used in the final column (therapy).
% WPI | Functional class | Therapy |
5 | I | Nil |
10 | I | Drug(s) |
15 | I | Surgery/cath/PPM/Device |
20 | II | Nil |
30 | II | Drug(s) |
40 | II | Surgery/cath/PPM/Device |
45 | III | Nil |
50 | III | Drug(s) |
55 | III | Surgery/cath/PPM/Device |
60 | IV | Not applicable |
Note to Table 1.3
- Therapy—column 3:
‘cath’ means either catheter ablation or catheter-associated therapy for arrhythmia
‘PPM’ means permanent pacemaker
‘Device’ means implanted defibrillator.
Amputatees should not be assessed under Table 1.4. They should be assessed under Table 9.5: Lower extremity amputations (see Chapter 9—The musculoskeletal system).
A WPI rating from Table 1.4 must not be combined with a WPI rating from Table 13.4: Thrombotic disorders (see Chapter 13—The haematopoietic system).
Table 1.4: Peripheral vascular disease of the lower extremities
% WPI | Signs and symptoms |
0 | The employee experiences neither intermittent claudication nor ischaemic pain at rest. |
5 | The employee has no difficulty with distances but experiences ischaemic pain on climbing either steps or gradients. |
10 | The employee experiences claudication on walking 200 metres or more at an average pace on level ground. |
20 | The employee experiences claudication on walking more than 100 but less than 200 metres at average pace on level ground. |
30 | The employee experiences claudication on walking more than 75 but less than 100 metres at average pace on level ground. |
40 | The employee experiences claudication on walking more than 50 but less than 75 metres at average pace on level ground. |
50 | The employee experiences claudication on walking more than 25 but less than 50 metres at average pace on level ground. |
60 | The employee experiences claudication on walking less than 25 metres at average pace on level ground. |
70 | The employee experiences ischaemic pain at rest. |
Amputees should not be assessed under Table 1.5. They should be assessed under Table 9.12.1: Upper extremity amputations, or Table 9.12.2: Amputation of digits (see Chapter 9—The musculoskeletal system).
A WPI rating from Table 1.5 must not be combined with a WPI rating from Table 13.4: Thrombotic disorders (see Chapter 13—The haematopoietic system).
Table 1.5 Peripheral vascular disease of the upper extremities
% WPI | Symptoms | Signs |
5 | Either no claudication or transient oedema. | Calcification of arteries on X-ray. |
10 | Either no claudication or persistent oedema controlled by support. | Dilatation of either arteries or veins. |
15 | As above. | Either loss of pulse or healed ulcer or surgery. |
20 | Either claudication on strenuous exercise or persistent oedema uncontrolled by support. | Either calcification of arteries on X-ray or dilatation of either arteries or veins. |
30 | As above. | Superficial ulcer. |
40 | As above. | Either deep or widespread ulcer or surgery. |
45 | Claudication on mild-moderate exertion. | Either calcification of arteries on X-ray or dilatation of either arteries or veins. |
50 | As above. | Superficial ulcer. |
55 | As above. | Either deep or widespread ulcer or surgery. |
60 | Rest pain/unable to exercise. | Not applicable |
Functional class (determined according to Figure 1-C below) is the primary criterion for assessment. Signs of vasospastic disease and therapy (see Table 1.6 on the following page) are secondary criteria for assessment.
Figure 1-C: Definitions of functional class
See note to immediately following Figure 1-C.
Functional Class | Symptoms |
I | No limitation of physical activity. |
II | Slight limitation of physical activity. Comfortable at rest and with ordinary, light activities of daily living. Greater activity causes symptoms. |
III | Marked limitation of physical activity. Comfortable at rest. Ordinary activity causes symptoms. |
IV | Inability to carry out any physical activity without discomfort. |
Note to Figure 1-C
- Figure 1-C also appears in Section 1.3—Arrhythmias, see page 37. It is repeated here for ease of reference
Table 1.6: Raynaud’s disease
See note immediately following Table 1.6.
% WPI | Functional class | Signs | Therapy |
5 | I | Nil. | Nil. |
10 | I | Nil. | Drug(s). |
15 | I | Nil. | Surgery. |
20 | II | Neither ulceration nor trophic changes. | Drug(s). |
25 | II | Either ulceration or trophic changes. | Drug(s). |
30 | II | not applicable | Surgery. |
35 | III | Neither ulceration nor trophic changes. | Drug(s). |
40 | III | Either ulceration or trophic changes. | Drug(s). |
45 | III | Not applicable | Surgery. |
50 | IV | Not applicable | Not applicable |
Note to Table 1.6
- Therapy—final column of Table 1.6:
Surgery includes sympathectomy and local debridement.
Drug(s) means continuous therapy with one or more drugs.
2.0 Introduction
2.1 Assessing impairment to respiratory function
2.1.1 Measurements
2.1.2 Methods of measurement
2.1.3 Impairment rating
2.2 Asthma and other hyper-reactive airways diseases
2.3 Lung cancer and mesothelioma
2.4 Breathing disorders associated with sleep
In conducting an assessment, the assessor must have regard to the principles of assessment (see pages 23-26) and the definitions contained in the glossary (see pages 27-28).
The measure of impairment is the reduction in physiological function below that found in health.
Respiratory impairment is quantified by the degree to which measurements of respiratory function are changed by the compensable injury or injuries, relative to values obtained in a healthy reference population of similar individuals.
Conditions such as chronic obstructive airways disease and chronic bronchitis are to be assessed according to the methods used to measure loss of respiratory function.
Employees who have permanent respiratory limitation secondary to massive pulmonary embolism should be assessed under Chapter 2. Any WPI rating awarded in these circumstances must not be combined with a WPI rating from Table 13.4: Thrombotic disorders (see Chapter 13—The haematopoietic system).
The most commonly recommended measurements for determining respiratory impairment are:
- spirometry with measurement of the forced expiratory volume at 1 second (FEV1) and forced vital capacity (FVC)
- the transfer factor, or diffusing capacity of the lung, for carbon monoxide (TlCO), measured by the single breath method.
However, the measurements used must be derived from either:
- the tests prescribed below where relevant (for example, in assessing asthma)
- where a test is not prescribed, from tests appropriate to assessing the impairments caused by the particular compensable condition or conditions.
Other measurements commonly used to assess impairment include:
- the lung volumes
- total lung capacity (TLC) and residual volume (RV)
- the response to a maximum exercise test including measurement of the oxygen consumption at the maximum workload able to be achieved (vO2max), and the degree of arterial oxygen desaturation during exercise.
On occasion, other measurements may be needed to define impairment accurately. For example:
- the elastic and flow resistive properties of the lungs
- respiratory muscle strength
- arterial blood gases
- polysomnography (sleep studies)
- echocardiography with estimation of pulmonary artery pressure
- quantitative ventilation-perfusion scans of the lung.
Measurement of the partial pressures of oxygen and carbon dioxide in arterial blood (PaO2 and PaCO2 respectively) are not usually required to assign impairment ratings accurately. However, individual variation may result in severe impairment in gas exchange when other measures of function indicate only moderate impairment. Arterial PaO2 of <55 mm Hg and/or PaCO2 >50 mm Hg, despite optimal treatment, is evidence of severe impairment and attracts a WPI rating of 70%.
Measurements of arterial blood gases should be performed on two occasions, with the employee seated.
Measurements must be performed in a manner consistent with the methods used by a respiratory function laboratory accredited by one or more of the following bodies:
- the Thoracic Society of Australia and New Zealand
- the Australian Sleep Society
- the Australian Council on Health Care Standards.
Methods of measurement should conform to internationally recognised standards in relation to the equipment used, the procedure, and analysis of the data. Reference values (‘predicted’ normal values) should be representative of the healthy population and be appropriate for ethnicity where possible. Laboratories providing measurements used to assess impairment should state the method(s) of measurement used, and the source of the reference values used.
Several professional groups have published criteria for rating the severity of impairment based on spirometry, gas transfer and vO2max. These professional groups include the Thoracic Society of Australia and New Zealand (Abramson, 1996), the American Thoracic Society (American Thoracic Society Ad Hoc Committee on Impairment/Disability Criteria, 1986), and the American Medical Association (2001). In general, measurements are expressed as a percentage of the predicted value (%P) and, where several measurements are performed, the most abnormal result is used to classify the degree of impairment.
Severity of impairment is rated as shown in Table 2.1 below. This generic table can be used to assign WPI ratings using any valid measurement for which there are predicted normal data.
Table 2.1: Conversion of respiratory function values to impairment
See note immediately following Table 2.1.
% WPI | Respiratory function %P |
0 | >85 |
10 | 85 to 76 |
20 | 75 to 66 |
30 | 65 to 56 |
40 | 55 to 51 |
50 | 50 to 44 |
60 | 45 to 41 |
70 | 40 to 36 |
80 |  35 35
|
Note to Table 2.1
- %P = percentage of mean value for healthy individuals of the same age, height and sex.
Assessment of impairment due to asthma can be confounded by the natural history of occupational asthma, by variably severe airflow obstruction, and therefore variable FEV1, and by response to treatment.
For hyper-reactivity of airways due to occupational exposures, assessment of impairment is made after:
- the diagnosis and cause are established
- exposure to the provoking factors is eliminated
- appropriate treatment of asthma is implemented.
Appropriate treatment follows the guidelines in the Asthma Management Handbook 2002 (National Asthma Council, 2002, 5th edition, Melbourne: National Asthma Council of Australia), a later edition of those guidelines, or later guidelines widely accepted by the medical profession as representing best practice.
Permanent impairment should not be assessed until 2 years after cessation of exposure to provoking factors as severity may decrease during this period.
An impairment rating scale is set out in Figure 2-A and Table 2.2 (both on following page). The scale used in Figure 2-A and Table 2.2 is modified to account for frequency of increased impairment from asthma despite optimal treatment.
A score reflecting impairment from asthma is calculated by:
- adding the points scored for reduction in FEV1 %P
and either
- change in FEV1 with bronchodilator (reversibility)
or
- degree of bronchial hyperreactivity defined by the cumulative dose of metacholine, or histamine, required to decrease baseline FEV1 by at least 20%
and
- measurement of FEV1, or peak flow (PF) rate, measured by the employee morning and evening, before and after aerosol bronchodilator, for at least 30 days.
The number of days on which any valid measurement of FEV1 or PF is less than 0.85 x the mean of the six highest values of FEV1 or PF during the monitoring period is to be expressed as a percentage of total days in the monitoring period.
The maximum impairment score from Figure 2-A is 11. One additional point is given, yielding a score of 12, if asthma cannot be controlled adequately with maximal treatment. The score from Figure 2-A is converted to a WPI rating using Table 2.2.
Figure 2-A: Calculating asthma impairment score
See notes immediately following Figure 2-A.
Score | FEV1, % P After bronchodilator | FEV1, % change in FEV1 with bronchodilator | PD20 or mol | % of Days lowest FEV1* is 0.85 highest FEV1 |
0 | >85 | <10 | >4.0 | <6 |
1 | 76 to 85 | 10 to 19 | 0.26 to 4.0 | 6 to 24 |
2 | 66 to 75 | 20 to 29 | 0.063 to 0.25 | 25 to 34 |
3 | 56 to 65 |  30 30
| 0.062 | 35 to 44 |
4 |  55 55
| | | 45 |
Notes to Figure 2-A
- Figure 2-A is based on scales proposed by: the American Thoracic Society (1993), as adapted in Tables 5-9 and 5-10 of American Medical Association’s Guides to the Evaluation of Permanent Impairment (5th edition, 2001); and the Thoracic Society of Australia and New Zealand (Abramson, 1996).
- %P = percent predicted normal value.
- PD20 = cumulative dose of inhaled metacholine aerosol causing a 20% decrease in FEV1.
- * monitored twice daily before and after aerosol bronchodilator for at least 30 days during adequate treatment.
- % of days = proportion of days any value of FEV1 (or of peak flow rate) is less than highest repeatable FEV1
(or peak flow rate) x 0.85.
Table 2.2: WPI derived from asthma impairment score
% WPI | Asthma impairment score |
0 | 0 |
10 | 1 |
20 | 2 |
30 | 3 |
40 | 4 |
45 | 5 |
50 | 6 |
55 | 7 |
60 | 8 |
65 | 9 |
70 | 10 |
75 | 11 |
80 | 12 |
Employees with lung cancers (other than mesothelioma) are considered severely impaired at the time of diagnosis and are given a WPI rating of 70%.
If there is evidence of tumour, or if tumour recurs one year after diagnosis is established, then the employee remains severely impaired and the WPI rating is increased to 80%.
Employees with mesothelioma are considered severely impaired and a WPI rating of 85 % is awarded upon diagnosis.
Some disorders such as obstructive sleep apnoea, central sleep apnoea, and hypoventilation during sleep, can cause impairment which is not quantifiable by standard measurements of respiratory function such as spirometry, diffusing capacity, or response to exercise.
Obstructive sleep apnoea should be assessed using Table 2.4 below. Central sleep apnoea should be assessed using Table 12.1.3: Sleep and arousal disorders (see Chapter 12—The neurological system).
An overnight sleep study is used to define the severity of sleep-related disorders of breathing and can be used to define impairment after appropriate treatment has been implemented. During the overnight sleep study there is continuous monitoring of breathing pattern, respiratory effort, arterial oxygen saturation, electrocardiogram, and sleep state. Results of sleep studies cannot readily be expressed in terms of a percentage of predicted values. Consequently, impairment is rated by assigning scores to the degree of abnormality at sleep study (Figure 2-B below and Table 2.4 on the following page). These ratings are based on frequency of disordered breathing, frequency of sleep disturbance, degree of hypoxaemia and, as appropriate, hypercapnoea during sleep. In addition, degree of daytime sleepiness is assessed using the Epworth sleepiness scale (Johns, 1991).
Where vascular morbidity is present (for example, high blood pressure or myocardial infarction) and is attributable to sleep apnoea, impairment should be assessed using the relevant table in Chapter 1—The cardiovascular system.
The total score derived from Figure 2-B below is the sum of the scores from each column: the maximum score is 12. This score is converted to a WPI rating using Table 2.4.
Figure 2-B: Calculating obstructive sleep apnoea score
See notes immediately following Figure 2-B.
Score | Epworth sleepiness score | Apnoeas + hypopnoeas/hr of sleep | Respiratory arousals*/hr of sleep | Cumulative sleep time, mins, with SaO2 <90% # |
0 | <5 | <5 | <5 | 0 |
1 | 5 to 10 | 5 to 15 | 5 to 15 | <15 |
2 | 11 to 17 | 16 to 30 | 16 to 30 | 15 to 45 |
3 | >17 | >30 | >30 | >45 |
Notes to Figure 2-B
1 *An arousal within 3 seconds of a sequence of breaths which meet the criteria for an apnoea, an hypopnoea, or a respiratory effort related arousal, as defined by the American Academy of Sleep Medicine (1999).
2 #SaO2 = arterial oxygen saturation measured with a pulse oximeter.
Table 2.4: WPI derived from obstructive sleep apnoea score
% WPI | Sleep apnoea score |
0 | 0 |
10 | 1 |
20 | 2 |
30 | 3 |
40 | 4 |
45 | 5 |
50 | 6 |
55 | 7 |
60 | 8 |
65 | 9 |
70 | 10 |
75 | 11 |
80 | 12 |
3.0 Introduction
3.1 Thyroid and parathyroid glands
3.2 Adrenal cortex and medulla
3.3 Pancreas (diabetes mellitus)
3.4 Gonads and mammary glands
In conducting an assessment, the assessor must have regard to the principles of assessment (see pages 23-26) and the definitions contained in the glossary (see pages 27-28).
The degree of impairment caused by secondary conditions (such as peripheral neuropathy, or peripheral vascular disease) accompanying an endocrine system condition must also be assessed under the relevant tables in other chapters, including tables in Chapter 10—The urinary system.
In this circumstance, using the combined values chart (Appendix 1), WPI ratings derived from the relevant tables in other chapters are combined with WPI ratings from tables in Chapter 3.
Hyperthyroidism is not considered to cause permanent impairment because the condition is usually amenable to treatment. Where visual and/or cosmetic effects resulting from exophthalmos persist following correction of the hyperthyroidism, a WPI rating may be derived from:
- Chapter 4—Disfigurement and skin disorders
- Chapter 6—The visual system (see section 6.5—Other conditions causing permanent deformities causing up to 10% impairment of the whole person).
Hyperparathyroidism is usually amenable to correction by surgery. If surgery fails, or the employee cannot undergo surgery for sound medical reasons, long-term therapy may be needed. If so, permanent impairment can be assessed after stabilisation of the condition with medication, in accordance with the criteria in Table 3.1 below.
Where an employee has more than one of the conditions in Table 3.1 below, combine the WPI ratings using the combined values chart (see Appendix 1).
Permanent secondary impairment resulting from persistent hyperparathyroidism (such as renal calculi or renal failure) should be assessed under the relevant system (for example, Chapter 10—The urinary system).
Table 3.1 Thyroid and parathyroid glands
% WPI | Criteria |
0 | Hyperparathyroidism—symptoms and signs readily controlled by medication or other treatment such as surgery. Hyperparathyroidism—symptoms and signs readily controlled by medication. Hyperparathyroidism adequately controlled by replacement therapy. |
10-15 | Hypothyroidism where the presence of a disease in another body system prevents adequate replacement therapy. Hyperparathyroidism—persisting mild hypocalcaemia, despite medication. Hyperparathyroidism—symptoms and signs such as intermittent hyper or hypocalcaemia not readily controlled by medication. |
30 | Hyperparathyroidism—persisting severe hypocalcaemia with serum calcium above 3.0mmol/l, despite medication. |
Notes to Table 3.1
- Assessors should refer to the Principles of Assessment for guidance on awarding an impairment value within a range.
Where Cushing’s syndrome is present, Table 3.2 below should be used to evaluate impairment from the general effects of hypersecretion of adrenal steroids (for example, myopathy, easy bruising, and obesity).
Using the combined values chart (see Appendix 1), WPI ratings derived from Table 3.2 may be combined with WPI ratings for specific associated secondary impairments (for example, fractures or diabetes mellitus).
Table 3.2 Adrenal cortex and medulla
% WPI | Criteria |
0 | Cushing’s syndrome—surgically corrected by removal of adrenal adenoma or removal of the source of ectopic ACTH secretion. Phaeochromocytoma—benign tumour, surgically removed or removable where hypertension has not led to the development of permanent cardiovascular disease. |
5 | Hypoadrenalism—symptoms and signs readily controlled with replacement therapy. Cushing’s syndrome due to moderate doses of glucocorticoids (for example, less than equivalent of 15mg of prednisolone per day) where glucocorticoids will be required long-term. |
10 | Cushing’s syndrome—surgically corrected by removal of pituitary adenoma or adrenal carcinoma. |
15 | Cushing’s syndrome—due to: - bilateral adrenal hyperplasia treated by adrenalectomy
- large doses of glucocorticoids (for example, equivalent of at least 15 mg of prednisolone per day) where glucocorticoids will be required long-term
- inadequate removal of source of ectopic ACTH secretion.
Phaeochromocytoma—malignant tumour where signs and symptoms of catecholamine excess can be controlled by blocking agents. Hypoadrenalism—recurrent episodes of adrenal crisis during acute illness or in response to significant stress. |
70 | Phaeochromocytoma—metastatic malignant tumour where signs and symptoms of catecholamine excess cannot be controlled by blocking agents or other treatment. |
Where diabetic retinopathy has led to visual impairment, the visual impairment should be assessed using Chapter 6—The visual system.
Where diabetes has led to secondary impairment of renal function, that impairment should be assessed using Chapter 10—The urinary system.
Using the combined values chart (see Appendix 1), WPI ratings derived under Table 3.1 and Table 3.2 may be combined with WPI ratings from Table 3.3 below.
Microangiopathy may be manifest as retinopathy (background, proliferative, or maculopathy) and/or albuminuria measured with a timed specimen of urine. Where there is an overnight collection, the upper limit of normal is 20 g/minute. Where a 24 hour specimen is collected, the upper limit of normal is 30mg/day. Albuminuria must be documented in at least two out of three consecutive urine specimens collected.
Table 3.3: Pancreas (diabetes mellitus)
See notes to Table 3.3 on the following page.
% WPI | Type | Therapy | Microvascular complications |
5 | Type 2 (NIDDM) | Dietary restrictions with or without oral hypoglycaemic agents give satisfactory control. | Microangiopathy is not present. |
10 | Type 2 (NIDDM) | Dietary restrictions with or without oral hypoglycaemic agents give satisfactory control. | Microangiopathy and/or significant neuropathy are present. |
15 | Type 1 (IDDM) | Dietary restrictions and insulin give satisfactory control. | Microangiopathy is not present. |
20 | Type 1 (IDDM) Type 2 (NIDDM) | Dietary restrictions and insulin give satisfactory control Type 2 (NIDDM) where dietary restrictions & insulin and/or oral hypoglycaemic agents give satisfactory control. | Microangiopathy and/or significant neuropathy are present. |
25 | Type 1 (IDDM) | Dietary restrictions and insulin do not give satisfactory control and frequent episodes of severe hypoglycaemia requiring the assistance of another person have been documented. | Microangiopathy is not present. |
30 | Type 1 (IDDM) | Dietary restrictions and insulin do not give satisfactory control and frequent episodes of severe hypoglycaemia requiring the assistance of another person have been documented. | Microangiopathy is present. |
40 | Type 1 (IDDM) | Dietary restrictions and insulin do not give satisfactory control and frequent episodes of severe hypoglycaemia requiring the assistance of another person have been documented. | Microangiopathy is present as well as significant neuropathy. |
50 | | Symptomatic hypoglycaemia due to metastatic tumour (usually insulinoma), uncontrolled by medication (such as diazoxide). | |
Notes to Table 3.3
- For the purposes of Table 3.3, the degree of control is defined by reference to the glycated haemoglobin measurement (HbA1c) where:
- 4%-6% is the non-diabetic range
- <8% is indicative of satisfactory control for the purposes of this table.
2. ‘Significant neuropathy’ means persistent symptoms of peripheral or autonomic neuropathy which interfere with quality of life to a considerable degree.
3. ‘NIDDM’ means non-insulin dependent diabetes mellitus.
4. ‘IDDM’ means insulin dependent diabetes mellitus.
Impairments resulting from inability to reproduce, and other impairments associated with gonadal dysfunction, are assessed under Chapter 11—The reproductive system.
Loss of one or both breasts in females should also be assessed using Table 4.3: Bodily disfigurement (see Chapter 4—Disfigurement and skin disorders). Using the combined values chart (see Appendix 1), a WPI rating derived from Table 4.3 may be combined with a WPI rating derived from Table 3.4 below.
Table 3.4: Gonads and mammary glands
% WPI | Criteria |
0 | Diminished or absent level of gonadal hormones in either sex. Abnormally high level of gonadal hormones in either sex. |
5 | Loss of one or both breasts in male. Loss of whole or part of one breast in female. Gynaecomastia in male where pain interferes with everyday activities—not controlled by medication. |
10 | Loss of whole or part of both breasts in female. |
4.0 Introduction
4.1 Skin disorders
4.2 Facial disfigurement
4.3 Bodily disfigurement
In conducting an assessment, the assessor must have regard to the principles of assessment (see pages 23-26) and the definitions contained in the glossary (see pages 27-28).
Impairments assessed under Chapter 4 include those caused by secondary conditions accompanying an endocrine system condition. A WPI rating from a table in Chapter 3—The endocrine system should be combined with WPI ratings resulting from the secondary conditions assessed under Chapter 4.
Loss of one or both breasts in females should be assessed under both:
- Table 3.4: Gonads and mammary glands (see Chapter 3—The endocrine system)
- Table 4.3: Bodily disfigurement
- and the resulting WPI ratings combined.
In cases where two or three of Tables 4.1, 4.2 and 4.3 apply, WPI ratings from each table can be combined using the combined values chart (see Appendix 1).
WPI ratings awarded under Table 4.2 cannot be combined with WPI ratings arising under section 6.4—Other ocular abnormalities, or section 6.5—Other conditions causing permanent deformities causing up to 10% impairment of the whole person (see Chapter 6—The visual system).
For the purposes of Table 4.1: Skin disorders:
- ‘intermittent treatment’ means a course of treatment leading to a break, treatment alternately ceasing and beginning again
- ‘constant treatment’ means treatment that continues on a regular basis without interruption
- ‘complex treatment’ means treatment that requires regular and close supervision, usually by a dermatologist. Such supervision could involve regular blood tests and relevant regular physical examinations, such as blood pressure measurement. Complex treatments would be expected to have potential adverse side effects. Categories of drugs forming a part of, or the whole of, complex treatment would include high doses of systemic corticosteroids, or immunosuppressive medications such as azathioprine, methotrexate and cyclosporin. Phototherapy, photochemotherapy, or photophoresis, would also be considered complex treatments.
Column 4 in Table 4.1 is referenced to Figure 4-A: Activities of daily living, immediately below the table.
Table 4.1: Skin disorders
% WPI | Signs and symptoms | Requirement for treatment | Column 4 Activities of daily living affected |
0 | Absent | None, intermittent | up to 2 |
5 | Absent | Constant | up to 2 |
5 | Intermittent | Intermittent or constant | up to 2 |
10 | Present on a daily basis for periods aggregating three or more months per year, but less than six months per year. | Intermittent or constant | 1 or more |
15 | Present on a daily basis for period aggregating six or more months per year, but less than nine months per year. | Intermittent or constant | 1 or more |
20 | Present on a daily basis for periods aggregating nine months per year or more. | Intermittent or constant | 1 or more |
25 | Present on a daily basis for periods aggregating nine months per year or more. | Constant | 4 or more |
30 | Present on a daily basis for period aggregating nine months per year or more. | Constant and complex | 6 or more |
Figure 4-A: Activities of daily living—See Column 4 in Table 4.1
No. | Activities | Examples |
1 | Self care, personal hygiene | Bathing, grooming, dressing, eating, eliminating. |
2 | Communication | Hearing, speaking, reading, writing, using keyboard. |
3 | Physical activity | Standing, sitting, reclining, walking, stooping, squatting, kneeling, reaching, bending, twisting, leaning, carrying, lifting, pulling, pushing, climbing, exercising. |
4 | Sensory function | Tactile feeling. |
5 | Hand functions | Grasping, holding, pinching, percussive movements, sensory discrimination. |
6 | Travel | Driving or travelling as a passenger. |
7 | Sexual function | Participating in desired sexual activity. |
8 | Sleep | Having a restful sleep pattern. |
9 | Social and recreational | Participating in individual or group activities, sports activities, hobbies. |
Table 4.2: Facial disfigurement
% WPI | Criteria |
0 | No structural changes. Normal facial appearance. Hyperpigmentation, depigmentation, redness or telangiectasis occupying less than 10% of facial area (excluding actinic damage). Scarring that does not significantly alter the appearance of the face. |
5 | Hyperpigmentation, depigmentation, redness or telangiectasis occupying 10% or more of the facial area (excluding actinic damage) or Scars and/or skin grafts occupying less than 5% of facial area that significantly alter the appearance of the face or Depressed cheek, nasal or frontal bones. Total or partial loss of one external ear. |
10 | Scars and/or skin grafts occupying 5-15% of facial area that significantly alter the appearance of the face or Total or partial loss of both external ears or Loss of less than 50% of the nose. |
15 | Scars and/or skin grafts occupying 15-25% of facial area that significantly alter the appearance of the face or Loss of 50-75% of the nose. |
20 | Scars and/or skin grafts occupying more than 25% of facial area that significantly alter the appearance of the face or Loss of more than 75% of the nose. |
Table 4.3: Bodily disfigurement
% WPI | Criteria |
0 | Normal body appearance. Scars and/or skin grafts occupying less than 10% of body area. |
5 | Scars and/or skin grafts occupying 11% to 20% of body surface. |
10 | Scars and/or skin grafts occupying 21% to 40% of body area or Tissue loss causing noticeable unilateral alteration of body silhouette. |
15 | Scars and/or skin grafts occupying 41% to 60% of body area. |
20 | Scars and/or skin grafts occupying 61% to 80% of body area or Tissue loss causing noticeable bilateral alteration of body silhouette. |
25 | Scars and/or skin grafts occupying more than 80% of body surface area. |
5.0 Introduction
5.1 Psychiatric conditions
In conducting an assessment, the assessor must have regard to the principles of assessment (see pages 23-26) and the definitions contained in the glossary (see pages 27-28).
For the purposes of Chapter 5, activities of daily living are those in Figure 5-A (see below). The examples provided below are not exhaustive and should not be seen as a substitute for assessor discretion when making decisions about impairment ratings.
Figure 5-A: Activities of daily living
Activity | Examples |
Self care, personal hygiene | Bathing, grooming, dressing, eating, eliminating. |
Communication | Hearing, speaking, reading, writing, using keyboard. |
Physical activity | Standing, sitting, reclining, walking, stooping, squatting, kneeling, reaching, bending, twisting, leaning, carrying, lifting, pulling, pushing, climbing, exercising. |
Sensory function | Tactile feeling. |
Hand functions | Grasping, holding, pinching, percussive movements, sensory discrimination. |
Travel | Driving or travelling as a passenger. |
Sexual function | Participating in desired sexual activity. |
Sleep | Having a restful sleep pattern. |
Social and recreational | Participating in individual or group activities, sports activities, hobbies. |
Table 5.1: Psychiatric conditions
See note to Table 5.1 on following page.
% WPI | Description of level of impairment |
0 | Reactions to stresses of daily living without loss of personal or social efficiency and Capable of performing activities of daily living without supervision or assistance. |
5 | Despite the presence of one of the following employee is capable of performing activities of daily living without supervision or assistance: - reactions to stresses of daily living with minor loss of personal or social efficiency
- lack of conscience directed behaviour without harm to community or self
- minor distortions of thinking.
|
10 | Despite the presence of more than one of the following employee is capable of performing activities of daily living without supervision or assistance: - reactions to stresses of daily living with minor loss of personal or social efficiency
- lack of conscience directed behaviour without harm to community or self
- minor distortions of thinking.
|
15 | Any one of the following accompanied by a need for some supervision and direction in activities of daily living: - reactions to stresses of daily living which cause modification to daily living patterns
- marked disturbances in thinking
- definite disturbance in behaviour.
|
Table 5.1 continued on following page
Table 5.1 (continued)
% WPI | Description of level of impairment |
20 | Any two of the following accompanied by a need for some supervision and direction in activities of daily living: - reactions to stresses of daily living which cause modification of daily living patterns
- marked disturbance in thinking
- definite disturbance in behaviour.
|
25 | All of the following accompanied by a need for some supervision and direction in activities of daily living: - reactions to stresses of daily living which cause modification of daily living patterns
- marked disturbances in thinking
- definite disturbances in behaviour.
|
30 | Any one of the following accompanied by a need for supervision and direction in activities of daily living: - hospital dischargees who require daily medication or regular therapy to avoid readmission
- loss of self-control and/or inability to learn from experience resulting in potential for considerable damage to self or community.
|
40 | More than one of the following accompanied by a need for supervision and direction in activities of daily living: - hospital dischargees who require daily medication or regular therapy to avoid readmission
- loss of self-control and/or inability to learn from experience resulting in potential for considerable damage to self or community.
|
50 | One of the following: - severe disturbances of thinking and/or behaviour entailing potential or actual harm to self and/or others
- need for supervision and direction in a confined environment.
|
60 | Both of the following: - severe disturbances of thinking and/or behaviour which entail potential or actual harm to self and/or others
- need for supervision and direction in a confined environment.
|
90 | Very severe disturbance in all aspects of thinking and behaviour requiring constant supervision and care in a confined environment, and assistance with all activities of daily living |
Notes to Table 5.1
2. Table 5.1 includes psychoses, neuroses, personality disorders and other diagnosable conditions. The assessment should be made on optimum medication at a stage where the condition is reasonably stable.
3. Supervision means the immediate presence of a suitable person, responsible in whole or in part for the care of the employee.
4. Assistance means the provision of assistance to the employee in performing the activities of daily living by a suitable person, responsible in whole or in part for the care of the employee
5. Direction means the provision of direction to the employee by a suitably qualified person, responsible in whole or in part for the care of the employee
6. Suitable person means a person capable of responsibly caring for the employee in an appropriate way
7. Suitably qualified person means a person with the necessary qualifications, experience and skills to provide appropriate direction to the employee. Such persons include medical practitioners, nursing staff and clinical psychologists.
6.0 Introduction
Steps in determining whole person impairment
6.1 Central visual acuity
6.1.1 Determining the loss of central vision in one eye
6.2 Determining loss of monocular visual fields
6.4 Other ocular abnormalities
6.5 Other conditions causing permanent deformities causing up to 10% impairment of the whole person
6.6 Calculation of visual system impairment for both eyes
In conducting an assessment, the assessor must have regard to the principles of assessment (see pages 23-26) and the definitions contained in the glossary (see pages 27-28).
Chapter 6 provides a standard method for examining the visual system, and for calculating the extent of any visual impairment. Impairment is any loss or abnormality in the anatomy or function of the visual system. The visual system includes the eyes, the ocular adnexa, and the visual pathways.
All visual tests are standardised and impairment assessment follows a strict protocol in order to ensure that different ophthalmologists can closely reproduce results. Wherever possible, impairment assessment should be performed by an ophthalmologist.
Visual impairment exists when there is deviation from any of the normal functions of the eye.
Among the types of visual impairment listed below, the first three (6.1-6.3) contribute the most to the overall impairment (numbers correspond to sections in Chapter 6):
6.1 Central visual acuity for near and far objects
6.2 Monocular visual field
6.3 Ocular motility
6.4 Other ocular abnormalities
6.5 Other conditions involving permanent deformities causing up to 10% impairment of the whole person.
Impairments assessed under Chapter 6 include those caused by secondary conditions accompanying an endocrine system condition. An impairment assessed under Chapter 3—The endocrine system should be combined with those resulting from the secondary conditions assessed under Chapter 6.
WPI ratings from Table 4.2: Facial disfigurement (see Chapter 4—Disfigurement and skin disorders), cannot be combined with WPI ratings arising from either:
- section 6.4—Other ocular abnormalities
- section 6.5—Other conditions causing permanent deformities causing up to 10% impairment of the whole person.
Facial nerve injury complicated by visual changes, such as occurs with corneal desiccation and scarring, rates as a significant impairment. Such an impairment is assessed under Chapter 6 and a resulting WPI rating may be combined with a WPI rating from Table 12.5.4: The Facial Nerve (VII) (see Chapter 12—The neurological system).
Steps in determining whole person impairment
See Figure 6-A on the following page for steps in deriving a visual system impairment rating. Use Table 6.1 (following Figure 6-A) to convert a visual system impairment rating to a WPI rating.
Figure 6-A: Steps for calculating impairment of the visual system
Step 1 | Determine and record the percentage loss of central vision for each eye separately, combining the losses of near and distance vision. Refer to Figure 6-C. |
Step 2 | Determine and record the percentage loss of visual fields for each eye separately (monocular) or for both eyes together (binocular). |
Step 3 | Using the combined values chart (see Appendix 1), combine the results from Step 1 and Step 2 for each eye if any central vision and visual field impairment is present. |
Step 4 | Determine and record the percentage loss of ocular motility. |
Step 5 | Using the combined values chart (see Appendix 1), combine the result of Step 3 with Step 4 if there is any ocular motility impairment. |
Step 6 | Determine and record the percentage loss if other ocular impairments are present. |
Step 7 | Using the combined values chart (see Appendix 1), combine the result of Step 5 with Step 6 if any other ocular impairment is present. |
Step 8 | Determine the visual impairment for both eyes. The visual impairment for both eyes is calculated by the formula: 3 x (impairment of better eye) + (impairment of worse eye) = visual system 4 impairment Alternatively use Figure 6-F. |
Step 9 | Convert the visual impairment for both eyes to a WPI rating using Table 6.1 below. |
Step 10 | Using the combined values chart (see Appendix 1), combine the result of Step 9 with any impairment (up to 10% maximum) arising from other conditions causing permanent deformities (see section 6.5). |
Table 6.1: Conversion of the visual system to whole person impairment rating
Source: American Medical Association Guides to the Evaluation of Permanent Impairment (4th edition, 1995, Table 6, Chapter 8, page 218).
Visual system | Whole person | Visual system | Whole person | Visual System | Whole person | Visual system | Whole person |
0 | 0 | | | | | | |
1 | 1 | 26 | 25 | 51 | 48 | 76 | 72 |
2 | 2 | 27 | 25 | 52 | 49 | 77 | 73 |
3 | 3 | 28 | 26 | 53 | 50 | 78 | 74 |
4 | 4 | 29 | 27 | 54 | 51 | 79 | 75 |
5 | 5 | 30 | 28 | 55 | 52 | 80 | 76 |
6 | 6 | 31 | 29 | 56 | 53 | 81 | 76 |
7 | 7 | 32 | 30 | 57 | 54 | 82 | 77 |
8 | 8 | 33 | 31 | 58 | 55 | 83 | 78 |
9 | 8 | 34 | 32 | 59 | 56 | 84 | 79 |
10 | 9 | 35 | 33 | 60 | 57 | 85 | 80 |
11 | 10 | 36 | 34 | 61 | 58 | 86 | 81 |
12 | 11 | 37 | 35 | 62 | 59 | 87 | 82 |
13 | 12 | 38 | 36 | 63 | 59 | 88 | 83 |
14 | 13 | 39 | 37 | 64 | 60 | 89 | 84 |
15 | 14 | 40 | 38 | 65 | 61 | 90 | 85 |
16 | 15 | 41 | 39 | 66 | 62 | 91 | 85 |
17 | 16 | 42 | 40 | 67 | 63 | 92 | 85 |
18 | 17 | 43 | 41 | 68 | 64 | 93 | 85 |
19 | 18 | 44 | 42 | 69 | 65 | 94 | 85 |
20 | 19 | 45 | 42 | 70 | 66 | 95 | 85 |
21 | 20 | 46 | 43 | 71 | 67 | 96 | 85 |
22 | 21 | 47 | 44 | 72 | 68 | 97 | 85 |
23 | 22 | 48 | 45 | 73 | 69 | 98 | 85 |
24 | 23 | 49 | 46 | 74 | 70 | 99 | 85 |
25 | 24 | 50 | 47 | 75 | 71 | 100 | 85 |
A Snellen test chart is used to measure the distance of visual acuity. The test distance is six metres.
The near vision is measured using a LogMar reading card. If Near Snellen, Jaeger, Sloan or Roman reading cards are used the results need to be converted to LogMar (see Figure 6-B below). The distance in the near reading test is not fixed: the reading distance should be recorded by the ophthalmologist.
Central vision should be tested and recorded for distant and near objects. The employee should be refracted and tested with loose lenses, phoropter, or with his / her own glasses, provided their correction is accurate.
If an employee wears contact lenses each day and wishes to wear them for the test, this is acceptable for measuring acuity. In certain ocular conditions (particularly in the presence of corneal abnormalities) contact lens-corrected vision may be better than that obtained with spectacle correction. However, if an employee does not already wear contact lenses, they should not be fitted for an impairment assessment.
Figure 6-B: Revised LogMar equivalent for different reading cards
LogMar | Near Snellen | Equivalent to Snellen | N. | Points Roman | Revised Jaeger standard |
0.3 | 14/14 | 6/6 | N5 | 3 | 1 |
0.4 | 14/18 | 6/7.5 | N6 | 4 | 2 |
0.5 | 14/21 | 6/9 | N7 | 5 | 3 |
0.6 | 14/24 | 6/12 | N8 | 6 | 4 |
0.65 | 14/28 | 6/15 | N9 | 7 | 5 |
0.7 | 14/35 | 6/18 | N10 | 8 | 6 |
0.725 | 14/40 | 6/24 | N12 | 9 | 7 |
0.75 | 14/45 | 6/30 | N15 | 10 | 8 |
0.8 | 14/60 | 6/36 | N17 | 11 | 9 |
0.9 | 14/70 | 6/48 | N18 | 12 | 10 |
1.0 | 14/80 | 6/60 | N20 | 13 | 11 |
1.1 | 14/88 | 6/90 | N24 | 14 | 12 |
1.3 | 14/112 | 6/120 | N40 | 21 | 13 |
1.6 | 14/140 | 6/240 | N80 | 23 | 14 |
The following steps are taken to determine loss of central vision in one eye.
Step 1 | Measure the central acuity for distance and near, correcting for any refractive errors and presbyopia, and record the result. |
Step 2 | Consult Figure 6-C below to derive the overall loss, combining the values for corrected near and distance acuities. |
Step 3 | If monocular aphakia or pseudoaphakia is present then add 50% to the percentage loss of Central Vision obtained from Figure 6-C. |
Figure 6-C: Percentage loss of central vision in one eye
| Revised LogMar standard for near vision |
Distance vision (metric 6) | 0.3 | 0.4 | 0.4 | 0.5 | 0.6 | 0.7 | 0.7 | 0.7 | 0.8 | 0.9 | 1.0 | 1.1 | 1.3 | 1.6 |
6/5 | 0 | 0 | 3 | 4 | 5 | 25 | 27 | 30 | 40 | 43 | 44 | 45 | 48 | 49 |
6/6 | 0 | 0 | 3 | 4 | 5 | 25 | 27 | 30 | 40 | 43 | 44 | 46 | 48 | 49 |
6/7.5 | 3 | 3 | 5 | 6 | 8 | 28 | 30 | 33 | 43 | 45 | 46 | 48 | 50 | 52 |
6/10 | 5 | 5 | 8 | 9 | 10 | 30 | 32 | 35 | 45 | 48 | 49 | 50 | 53 | 54 |
6/12 | 8 | 8 | 10 | 11 | 13 | 33 | 35 | 38 | 48 | 50 | 5 | 53 | 55 | 57 |
6/15 | 13 | 13 | 15 | 16 | 18 | 38 | 40 | 43 | 53 | 55 | 56 | 58 | 60 | 62 |
6/20 | 16 | 16 | 18 | 20 | 22 | 41 | 44 | 46 | 56 | 59 | 60 | 61 | 64 | 65 |
6/22 | 18 | 18 | 21 | 22 | 23 | 43 | 46 | 48 | 58 | 61 | 62 | 63 | 66 | 67 |
6/24 | 20 | 20 | 23 | 24 | 25 | 45 | 47 | 50 | 60 | 63 | 64 | 65 | 68 | 69 |
6/30 | 25 | 25 | 28 | 29 | 30 | 50 | 52 | 55 | 58 | 68 | 69 | 70 | 73 | 74 |
6/38 | 30 | 30 | 33 | 34 | 35 | 55 | 57 | 60 | 70 | 73 | 74 | 75 | 78 | 79 |
6/50 | 34 | 34 | 37 | 38 | 39 | 59 | 61 | 64 | 74 | 77 | 78 | 79 | 82 | 83 |
6/60 | 40 | 40 | 43 | 44 | 45 | 65 | 67 | 70 | 80 | 83 | 84 | 85 | 88 | 89 |
6/90 | 43 | 43 | 45 | 46 | 48 | 68 | 70 | 73 | 83 | 85 | 86 | 88 | 90 | 92 |
6/120 | 45 | 45 | 48 | 49 | 50 | 70 | 72 | 75 | 85 | 88 | 89 | 90 | 93 | 94 |
6/240 | 48 | 48 | 50 | 51 | 53 | 73 | 75 | 78 | 88 | 90 | 91 | 93 | 95 | 97 |
There are many ways of measuring the visual field. The most common are the manual Goldman Field and the Humphrey, Octopus and Medmont computerised field analysers. If using a computerised field it is necessary to test at least a 30-2 threshold.
An Esterman Binocular Field is suitable for the majority of visual field impairment assessments. The field is tested with the employee wearing spectacles and both eyes open. The binocular field result is determined by using the Esterman 120-unit binocular grid, and the dot count is multiplied by 5/6 to obtain the percentage of retained or lost field. Note that binocular field-testing is not recommended when diplopia is present.
If the automated 30-2 Threshold Field is normal, and the ocular history and examination do not suggest lesions that would affect the outer part of the field, it is acceptable to conclude that the entire field is normal. Whatever technique is used to measure the visual field, the test should be performed by an ophthalmologist.
The normal visual field meridians in each of eight principal meridians are given in Figure 6-D below. The total, summed over 8 meridians is 500.
Figure 6-D: Normal extent of the visual field
Direction of vision | Degrees of field |
Temporally | 85 |
Down temporally | 85 |
Direct down | 65 |
Down nasally | 50 |
Nasally | 60 |
Up nasally | 55 |
Direct up | 45 |
Up temporally | 55 |
Total | 500 |
The percentage of retained vision is calculated using the following steps.
Step 1 | Add the extent of the visual field along each of the 8 meridians (while considering the maximum normal values for the meridians given in Figure 6-D). |
Step 2 | Divide by 5 to determine the percentage of visual field perception that remains. |
Step 3 | To obtain the percentage of visual field loss, subtract the percentage of visual field remaining from 100%. |
These steps are based upon the following formulae:
Total visual field = % of remaining visual field
5
100 - (% of remaining visual field) = % of visual field lost
Diplopia within the central 30 is measured by an ophthalmologist with a tangent screen. Unless there is diplopia within 30 of the centre of fixation, the diplopia does not cause significant visual impairment. The exception is when looking downwards. Double vision within the central 20 signifies the maximum loss of ocular motility (that is, a 50% loss of ocular motility in one eye).
If the diplopia is not within the central 20º, the presence of diplopia is then plotted along the 8 meridians (see Figure 6-E below). The largest percentage on any of the meridians in which there is double vision is the impairment percentage for loss of ocular motility.
Figure 6-E: Percentage loss of ocular motility of one eye in diplopia fields
Adapted from American Medical Association’s Guides to the Evaluation of Permanent Impairment, 4th edition, 1995,Chapter 8, page 217.


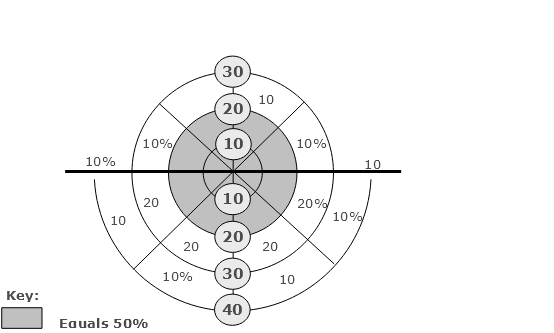
If an ocular adnexal disturbance or deformity interferes with visual function and is not reflected in diminished visual acuity, decreased visual fields, or ocular motility abnormalities with diplopia, then the significance of the disturbance or deformity should be evaluated by an examining ophthalmologist. In that situation, using the combined values chart (see Appendix 1), an ophthalmologist may combine up to an additional 10% impairment for each affected eye.
Problems in the visual system should also be taken into account where they result in symptoms such as epiphora, photophobia, metamorphopsia, and convergence insufficiency.
Using the combined values chart (see Appendix 1), an additional WPI of up to 10% may be combined with WPI ratings for conditions such as permanent deformities of the orbit, scars, and other cosmetic deformities that do not otherwise alter ocular function.
Figure 6-F (from the American Medical Association’s Guides to the Evaluation of Permanent Impairment, Chapter 8, page 219, 4th edition, 1995) is on the three following pages.
Figure 6-F was established using the equation:
3 x (impairment value of better eye) + (impairment value of worse eye) = impairment of
4 visual system
Percentages for the worse eye are read from the side of the table.
Percentages for the better eye are read from the bottom of the table.
The impairment of the visual system is at the intersection of the column for the worse eye and the row for the better eye.
For example, for a 40% impairment of one eye and 10% impairment of the other eye, read down the table until you come to the large value (40%). Follow across the row until it is intersected with the column designated by 10% at the bottom of the page (18%). Thus, the impairment to the visual system is 18%.
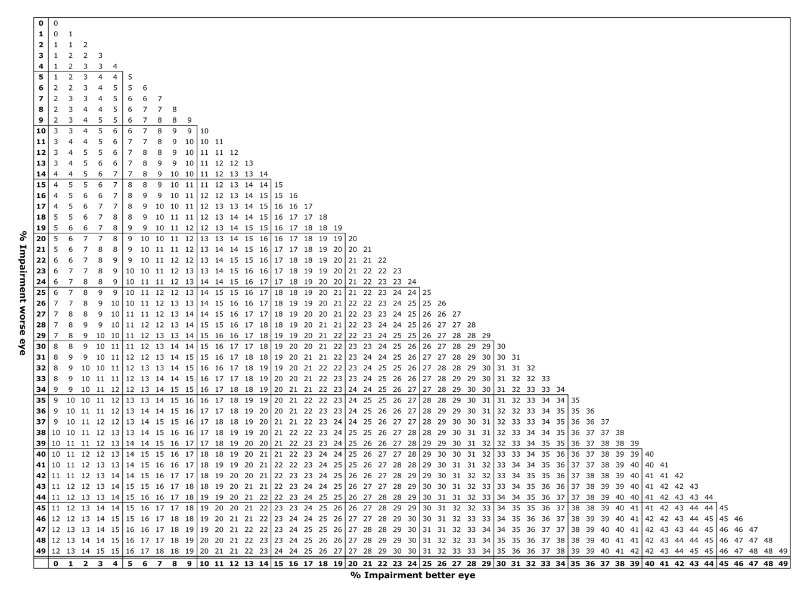
Figure 6-F: Calculation of visual system impairment for both eyes (continued)
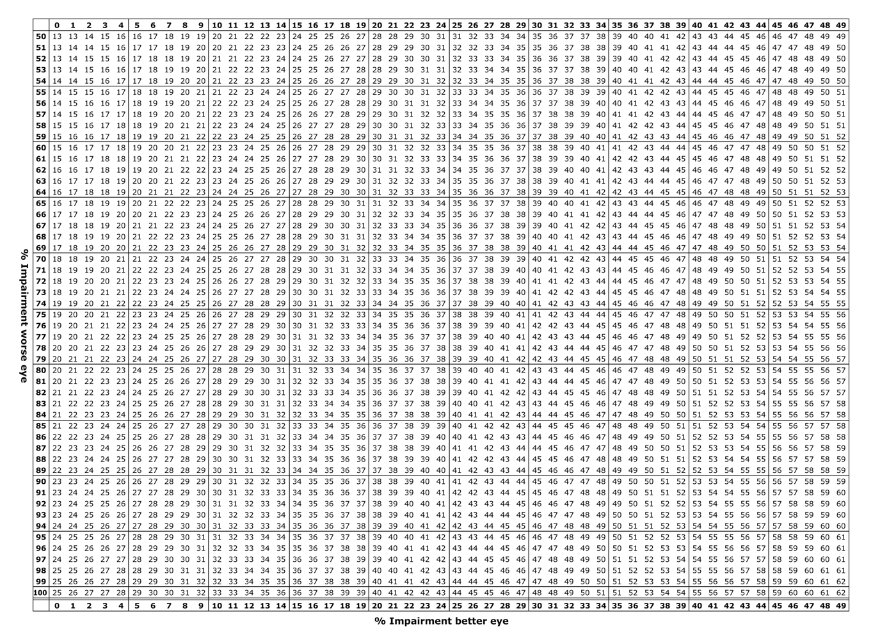
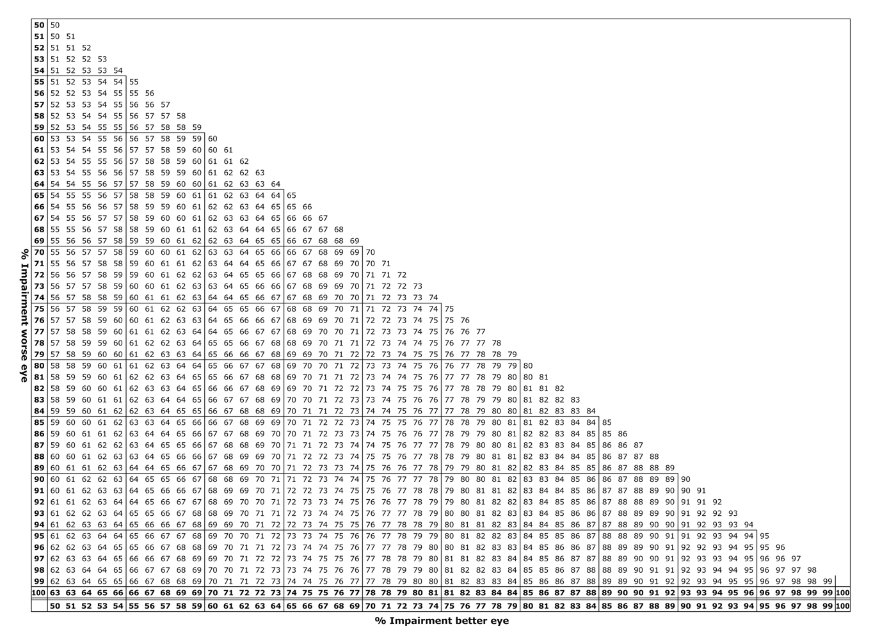
7.0 Introduction
7.1 Hearing loss
7.2 Tinnitus
7.3 Olfaction and taste
7.4 Speech
7.5 Air passage defects
7.6 Nasal passage defects
7.7 Chewing and swallowing
In conducting an assessment, the assessor must have regard to the principles of assessment (see pages 23-26) and the definitions contained in the glossary (see pages 27-28).
Table 12.5.5: The auditory nerve (see Chapter 12—The neurological system) should be used to assess both Menière’s disease, and true vertigo consequent upon a disturbance of vestibular function.
Unless they cause interference with balance, speech, respiration or hearing, the following conditions attract a WPI rating of 0:
- rhinitis
- sinusitis
- laryngitis
- pharyngitis
- otitis media or externa (whether permanent or intermittent).
If interference with balance, speech, respiration or hearing is present, these conditions attract WPI ratings based on the degree of interference with balance, speech, respiration or hearing as described in the tables in Chapter 7.
Hearing defects are assessed in accordance with the current procedures from Australian Hearing.
Once the binaural percentage loss of hearing has been calculated, it is then converted to a WPI rating.
The calculation for converting the percentage loss of hearing to a WPI rating is:
(Percentage Loss of Hearing)
2
Table 7.2 is used to assess impairment arising as a result of tinnitus in the presence of unilateral or bilateral hearing loss.
Table 7.2: Tinnitus
% WPI | Criteria |
0 | Continuous tinnitus which has nuisance value but can be forgotten or ignored with background noise or a low level noise generator. |
5 | Severe continuous tinnitus which causes extreme distress, interferes with concentration and is not assisted by a low level noise generator. |
Only complete loss of olfaction or taste attracts a WPI rating. If the employee is able to detect any odour or taste, even if unable to identify it, the WPI rating is 0.
WPI ratings from this table may not be combined with WPI ratings for the same condition from either Table 12.5.1: Olfactory Nerve (see Chapter 12—The neurological system), or Table 12.5.4: Facial nerve (see Chapter 12—The neurological system).
Table 7.3: Olfaction and taste
% WPI | Criterion |
5 | Complete loss of olfaction or Complete loss of taste. |
10 | Complete loss of olfaction and Complete loss of taste. |
Table 7.4 below is used to assess impairment resulting from interference with speech from local lesions of the organs of speech.
For the purposes of Table 7.4, ‘speech’ means the capacity to produce vocal signals that can be heard, understood, and sustained over a useful period of time.
Table 7.4 must not be used to assess speech impairment resulting from a lesion of the central nervous system. In such cases, assessment should be made under Table 12.3.2: Production of speech and language symbols (see Chapter 12—The neurological system).
WPI ratings from Table 7.4 may not be combined with WPI ratings from Table 12.3.2: Production of speech and language symbols (see Chapter 12—The neurological system).
If there are two separate conditions (one local, and the other a central nervous system condition) interfering with speech production, speech production should be assessed under both Table 7.4 and Table 12.3.2. The greater value is the WPI rating due to speech impairment from all causes.
WPI ratings from within Table 7.4 may not be combined with each other.
If the major problem is one of audibility, intelligibility, or functional efficiency of speech, the criteria appropriate to the area should be used to assess impairment.
If there are problems in more than one area, each area (audibility, intelligibility, and functional efficiency) should be assessed, and the highest value selected as the WPI rating.
Table 7.4: Speech
% WPI | Criteria |
Audibility | Intelligibility | Functional efficiency |
0 | Audible in most situations, although may require effort. | Generally intelligible, although some sounds are difficult and some repetition may be needed. | Speech can be sustained except for slowness and some hesitancy. |
10 | Audible in quiet situations but problems with audibility in noisy environments. | Intelligible although inaccuracies may be frequent and there are obvious difficulties with articulation. | Speech can be sustained but is often discontinuous, interrupted, hesitant and/or slow. |
15 | Voice tires rapidly, tends to become inaudible after a few seconds. Volume generally low. | Intelligible to family and close friends but strangers find speech generally unintelligible even with repetition. | Difficulty sustaining speech for more than brief periods even when speaking very slowly. |
20 | Volume very low. Can whisper or produce volume that can be heard only with difficulty by close listener or by telephone. | Mostly unintelligible, except for a few words. | Laboured speech. Rate of sustained speech impractically slow. |
30 | Inaudible. | Unintelligible. | No sustained speech. |
Table 7.5 assesses permanent impairment relating to defects of the air passages. Impairments of the lower airways and lung parenchyma, are dealt with in Chapter 2—Respiratory system.
Permanent tracheostomy, or other respiratory stoma, attracts a permanent WPI rating of 25% which may be combined with other values derived from Table 7.5.
An employee is placed in an impairment category based on the criteria in Table 7.5 below.
Table 7.5 applies only to permanent partial obstruction of one or more of the following structures:
- oropharnyx
- laryngopharynx
- larynx
- trachea.
Table 7.5 does not apply to nasal obstruction. Nasal obstruction is assessed under Table 7.6: Nasal passage defects (see below).
Prophylactic restriction of activity, such as sporting activity, does not attract the same WPI rating as dyspnoea on participation in the activity.
Table 7.5: Air passage defects
Criteria | % WPI |
0 | 10 | 30 | 40 | 50 | 70 | 90 |
Ventilation required | No | No | No | No | No | No | Yes |
Dyspnoea at rest | No | No | No | No | Yes | Yes (severe) | Not applicable |
Dyspnoea with dressing or grooming | No | No | No | Yes | Yes (severe) | Not applicable | Not applicable |
Dyspnoea with walking 200m or climbing eight steps | No | No | Yes | Not applicable | Not applicable | Not applicable | Not applicable |
Dyspnoea with hurrying, hill climbing or sporting activity | No | Yes | Not applicable | Not applicable | Not applicable | Not applicable | Not applicable |
Table 7.6 applies only to nasal obstruction.
Table 7.6: Nasal passage defects
% WPI | Criterion |
3 | Continuous nasal obstruction of sufficient severity to cause mouth breathing at rest. |
Table 7.7 below is used to assess impairment resulting from facial muscle damage or loss, dental and oral problems, and temporomandibular joint dysfunction.
WPI ratings derived from Table 7.7 may be combined with WPI ratings derived from Table 8.4: Surgically created stomas (see Chapter 8—The digestive system).
For the same condition, WPI ratings derived from Table 7.7 may not be combined with WPI ratings from Table 12.5.6: The glossopharyngeal, vagus, spinal accessory and hypoglossal nerves (see Chapter 12—The neurological system).
Table 7.7: Chewing and swallowing
% WPI | Criteria |
0 | No interference. Food of any desired type may be eaten without difficulty. |
2 | Very tough or hard food has to be avoided but diet is otherwise as desired. |
5 | Diet is limited to soft foods. |
10 | Diet is limited to pureed foods. |
20 | Diet is limited to liquid foods. |
40 | No oral ingestion of food or fluid is possible. Food can only be ingested by means of a nasogastric, gastrostomy, oesophagostomy or other tube. |
8.0 Introduction
Calculation of Body Mass Index (BMI)
8.1 Upper digestive tract—oesophagus, stomach, duodenum, small intestine and pancreas
8.2 Lower gastrointestinal tract—colon and rectum
8.3 Lower gastrointestinal tract—anus
8.4 Surgically created stomas
8.5 Liver—chronic hepatitis and parenchymal liver disease
8.6 Biliary tract
8.7 Hernias of the abdominal wall
In conducting an assessment, the assessor must have regard to the principles of assessment (see pages 23-26) and the definitions contained in the glossary (see pages 27-28).
‘Activities of daily living’ are activities which an employee needs to perform to function in a non-specific environment (that is, to live). Performance of activities of daily living is measured by reference to primary biological and psychosocial function.
For the purposes of Chapter 8, activities of daily living are those in Figure 8-A (see below).
Figure 8-A: Activities of daily living
Activity | Examples |
Self care, personal hygiene | Bathing, grooming, dressing, eating, eliminating. |
Communication | Hearing, speaking, reading, writing, using keyboard. |
Physical activity | Standing, sitting, reclining, walking, stooping, squatting, kneeling, reaching, bending, twisting, leaning, carrying, lifting, pulling, pushing, climbing, exercising. |
Sensory function | Tactile feeling. |
Hand functions | Grasping, holding, pinching, percussive movements, sensory discrimination. |
Travel | Driving or travelling as a passenger. |
Sexual function | Participating in desired sexual activity. |
Sleep | Having a restful sleep pattern. |
Social and recreational | Participating in individual or group activities, sports activities, hobbies. |
Tables 8.1, 8.2 and 8.3 refer to primary and secondary criteria. All criteria from both categories (except where otherwise stipulated) must be met before a WPI rating can be assigned.
Where the condition being assessed interferes with chewing and/or swallowing, assessment is made under whichever of the following tables describes the impairment more specifically:
- Table 7.7: Chewing and swallowing (see Chapter 7—Ear, nose and throat disorders)
- Table 12.5.6: The glossopharyngeal, vagus, spinal accessory and hypoglossal nerves (see Chapter 12—The neurological system).
For the same condition, WPI ratings derived from Table 12.5.6 may not be combined with WPI ratings derived from Table 7.7.
Other complications of bleeding disorders assessed under Table 13.3: Haemorrhagic disorders and platelet disorders (see Chapter 13—The haematopoietic system) may also be assessed under tables in Chapter 8, according to the site of the blood loss. The WPI rating so obtained should be combined with the WPI rating obtained from Table 13.3.
Where applicable, Body Mass Index (BMI) values are used as the objective assessment for weight. See Figure 8-B below for calculation of BMI values.
Calculation of Body Mass Index (BMI)
Body Mass Index (BMI) is calculated as follows:
Weight (kg)
Height2 (m)
The value obtained should be rounded to the nearest whole number.
Figure 8-B: Body Mass Index criteria
BMI | Category | Health risk |
<18 | Very underweight | Long-term hazard to health. |
18-20 | Underweight | Low risk to health. |
20-25 | Acceptable | Least risk for morbidity and minimal mortality. |
25-30 | Overweight | Low risk to health. |
30-40 | Morbid obesity | High degree of risk to health. |
Table 8.1: Upper digestive tract—oesophagus, stomach, duodenum, small intestine and pancreas
See notes to Table 8.1 on the following page.
% WPI | Primary criteria | Secondary criteria |
0 | Symptoms of upper digestive tract disease with or without anatomical loss or pathological alteration present. | Continuous drug treatment not required to control symptoms. |
10 | Symptoms of upper digestive tract disease, with anatomical loss or pathological alteration present. | One of the following: - Continuous drug treatment required to control symptoms, signs or nutritional deficiency
- Appropriate dietary modifications required to control symptoms or signs.
|
20 | Symptoms of upper digestive tract disease, with anatomical loss or pathological alteration present. | Both of the following: - Continuous drug treatment required to control symptoms, signs or nutritional deficiency
- Appropriate dietary modifications required to control symptoms or signs.
|
30 | Symptoms of upper digestive tract disease, with anatomical loss or pathological alteration present. | Any one of the following: - Continuous drug treatment does not completely control symptoms, signs or nutritional deficiency
- Appropriate dietary modifications do not completely control symptoms, signs or nutritional deficiency
- Weight loss with a BMI<20.
|
40 | Symptoms of upper digestive tract disease, with anatomical loss or pathological alteration present. | Any two of the following: - Continuous drug treatment does not completely control symptoms, signs or nutritional deficiency
- Appropriate dietary modifications do not completely control symptoms, signs or nutritional deficiency
- Weight loss with a BMI<20.
|
Table 8.1 continued on following page.
Table 8.1 (continued)
% WPI | Primary criteria | Secondary criteria |
50 | Symptoms of upper digestive tract disease, with anatomical loss or pathological alteration present. | All of the following: - Continuous drug treatment does not completely control symptoms, signs or nutritional deficiency
- Appropriate dietary modifications do not completely control symptoms, signs or nutritional deficiency
- Weight loss with a BMI<20.
|
60 | Symptoms of upper digestive tract disease, with anatomical loss or pathological alteration present. | All of the following: - Continuous drug treatment has little effect on symptoms, signs or nutritional deficiency
- Appropriate dietary modifications have little effect on symptoms, signs or nutritional deficiency
- Assistance required with most or all activities of daily living
- Weight loss with a BMI<20.
|
70 | Symptoms of upper digestive tract disease, with anatomical loss or pathological alteration present. | All of the following: - Severe impairment of nutritional status uncontrolled by any treatment or dietary modifications
- Assistance required with all activities of daily living
- Weight loss with a BMI<20.
|
Notes to Table 8.1
- Continuous drug treatment includes H2 receptor antagonists, proton pump inhibitors, corticosteroids, and pancreatic enzyme supplementation.
- Continuous drug treatment does not include antacids, or mixed antacid and alginic acid preparations.
- Modified diet does not include the avoidance of a few, or selected, food items. It refers to special diets devised to manage symptoms of the disease and maximise nutrition (for example, lactose-free diet, gluten-free diet).
Table 8.2: Lower gastrointestinal tract—colon and rectum
See notes to Table 8.2 on the following page.
% WPI | Primary criteria | Secondary criteria |
0 | Signs and/or symptoms of colonic or rectal disease occur infrequently, and/or are of brief duration. | No requirement for any of the following as short term treatment: - Limitation of activities of daily living
- Modified diet
- Medication.
No systemic manifestations. Weight and nutrition can be maintained at desirable levels. |
10 | Signs and/or symptoms of colonic or rectal disease occur more frequently, and/or are of longer duration. | Generally no requirement for any of the following as long-term treatment to control disease although may be needed short term: - Limitation of activities of daily living
- Modified diet
- Medication.
No systemic manifestations. Weight and nutrition can be maintained at desirable levels. |
20 | Objective evidence of colonic or rectal disease, with anatomical loss or alteration. | Requirement for at least one of the following as long-term treatment to control disease: - Limitation of activities of daily living
- Modified diet
- Medication.
No systemic manifestations. Weight and nutrition can be maintained at desirable levels. |
Table 8.2 continued on following page.
Table 8.2 (continued)
% WPI | Primary criteria | Secondary criteria |
30 | Objective evidence of colonic or rectal disease, with anatomical loss or alteration. | Requirement for all of the following as long-term treatment to control disease: - Limitation of activities of daily living
No systemic manifestations. Weight and nutrition can be maintained at desirable levels. |
40 | Objective evidence of colonic or rectal disease, with anatomical loss or alteration. | Requirement for all of the following as long-term treatment to control disease: - Limitation of activities of daily living
Presence of one of the following: - Systemic manifestations (for example, fever, anaemia)
- Weight loss with a BMI<20.
|
50 | Objective evidence of colonic or rectal disease, with anatomical loss or alteration. | Requirement for all of the following as long-term treatment to control disease: - Limitation of activities of daily living
Presence of both of the following: - Systemic manifestations (for example, fever, anaemia)
- Weight loss with a BMI<20.
|
Table 8.2 continued on following page.
Table 8.2 (continued)
% WPI | Primary criteria | Secondary criteria |
60 | Objective evidence of colonic or rectal disease, with anatomical loss or alteration. | None of the following long-term treatments control the disease: Presence of at least one of the following: - Limitation of Activities of Daily Living
- Systemic manifestations (for example, fever, anaemia)
- Weight loss with a BMI<20.
|
70 | Objective evidence of colonic or rectal disease, with anatomical loss or alteration. | None of the following long-term treatments control the disease: Presence of all of the following: - Systemic manifestations (for example, fever, anaemia)
- Assistance required with activities of daily living
- Weight loss with a BMI<20.
|
Notes to Table 8.2
- Medication does not include fibre supplements, vitamins or other nutritional supplements (unless there is a demonstrated vitamin deficiency), or over the counter preparations.
- Modified diet does not include the avoidance of a few, or selected food items. It refers to special diets devised to manage the symptoms of the disease and maximise nutrition (for example, lactose free diet, gluten free diet).
Where the anal disorder is part of a colo-rectal disorder (for example, Crohn’s Disease), WPI ratings from Tables 8.2: Lower gastrointestinal tract—colon and rectum (see page 92) and Table 8.3 may be combined using the combined values chart (see Appendix 1).
Table 8.3: Lower gastrointestinal tract—anus
% WPI | Primary criteria | Secondary criteria |
0 | Signs of organic anal disease are absent or There is no anatomical loss or alteration. | Incontinence of flatus, or other mild or intermittent anal symptoms which can be controlled by treatment. |
10 | Signs of organic anal disease are present or There is anatomical loss or alteration. | Mild incontinence of flatus and/or Mild incontinence of liquid stool and Mild or intermittent anal symptoms controlled by treatment. |
20 | Signs of organic anal disease are present or There is anatomical loss or alteration. | Moderate daily faecal incontinence requiring treatment or Continual anal symptoms incompletely controlled by treatment. |
30 | Signs of organic anal disease are present or There is anatomical loss or alteration. | Moderate daily faecal incontinence requiring treatment and Continual anal symptoms incompletely controlled by treatment. |
40 | Signs of organic anal disease are present and There is anatomical loss or alteration. | Total faecal incontinence despite treatment or Signs of organic anal disease with severe symptoms unresponsive or not amenable to treatment. |
Using the combined values chart (see Appendix 1), WPI ratings obtained from Table 8.4 may be combined with WPI ratings from other digestive system tables in Chapter 8, and with WPI ratings from Table 7.7: Chewing and swallowing (see page 86, Chapter 7—Ear, nose and throat disorders).
Table 8.4: Surgically created stomas
See note to Table 8.4 immediately following the table.
% WPI | Criteria |
10 | Colostomy. |
15 | Ileostomy. Ileal pouch-anal anastomosis. |
20 | Jejunostomy. Gastrostomy. Oesophagostomy. |
Note to Table 8.4
- Assessment for surgically created stomas is only allowed when the stoma is permanent and not a defunctioning or temporary stoma.
Table 8.5: Chronic hepatitis and parenchymal liver disease
See notes to Table 8.5 on the following page.
% WPI | Primary criteria | Secondary criteria |
0 | Evidence of persistent or intermittent liver disease. Histological severity—very mild. | Liver function tests may be normal or mildly abnormal. No history of jaundice, ascites or bleeding oesophageal varices in the last three years. Adequate nutritional state. |
10 - 15 | Evidence of persistent liver disease. Histological severity—mild. | Biochemistry abnormal. No history of jaundice, ascites, or bleeding oesophageal varices in the last three years. Adequate nutritional state. |
30 | Evidence of chronic liver disease. Histological severity—moderate. | Biochemistry abnormal. History of jaundice, ascites or bleeding oesophageal varices in the last 12 months. Adequate nutritional state |
40 | Evidence of progressive, chronic liver disease. Histological severity—severe. | Biochemistry abnormal. History of jaundice ascites, or bleeding oesophageal varices in the last 12 months. Adequate nutritional state. Easily fatigued. |
50 | Evidence of progressive, chronic liver disease. Histological severity—chronic hepatitis with cirrhosis. | Biochemistry abnormal. History of jaundice ascites, and/or bleeding oesophageal varices in the last 12 months. Nutritional state adversely affected. Fatigue and physical weakness. |
65 | Evidence of progressive, chronic liver disease. Histological severity—chronic hepatitis with cirrhosis. Persistent signs of hepatic insufficiency. | Biochemistry abnormal. History of jaundice, ascites and/or bleeding oesophageal varices in the last 12 months. Nutritional state adversely affected. Profound fatigue and physical weakness. |
Table 8.5 continued on following page.
Table 8.5 (continued)
% WPI | Primary criteria | Secondary criteria |
75 | Evidence of advanced, irreparable chronic liver disease. Histological severity—chronic hepatitis with cirrhosis. Persistent signs of advanced hepatic insufficiency. | Biochemistry abnormal. History of jaundice, ascites and/or bleeding oesophageal varices in the last 12 months. Nutritional state adversely affected. Profound fatigue and physical weakness. Assistance required with activities of daily living. |
Notes to Table 8.5
- Signs of liver disease include: the stigmata of liver disease (spider angiomata, palmar erythema, and gynaecomastia); jaundice; palpably enlarged liver; evidence of abnormal liver size on ultrasound; evidence of intrahepatic lesions on ultrasound or positive antibodies to any of the viruses known to have the potential to cause chronic liver disease.
- Jaundice does not include a mild elevation of plasma bilirubin with normal liver enzymes.
- Liver function tests include estimates of total bilirubin, albumin, alkaline phosphatase (ALP), aspartate transaminase (AST), alanine transaminase (ALT), and gamma glutamyl transferase (GGT).
- All the criteria, both major and minor, must be present before a particular WPI rating can be allocated. However, liver biopsy is not mandatory and should not be undertaken solely for the purpose of permanent impairment assessment.
- Where liver biopsy has not been undertaken the histological criteria may be disregarded.
- Assessors should refer to the Principles of Assessment for guidance on awarding an impairment value within a range.
Table 8.6: Biliary tract
See note to Table 8.6 immediately following the table.
% WPI | Criteria |
0 | Cholecystectomy with no biliary tract sequelae. |
10 | History of biliary type pain without identifiable biliary disease or Documented history of one to three episodes of biliary colic per year with identifiable biliary disease. |
20 | Documented history of four to six episodes of biliary colic per year with identifiable biliary disease. |
30 | Documented history of more than six episodes of biliary colic per year with identifiable biliary disease. |
40 | Permanent irreparable obstruction of the hepatic or common bile duct with recurrent cholangitis or permanent stent. |
50 | Permanent common bile duct obstruction with progressive liver disease manifest as persistent jaundice with intermittent hepatic insufficiency. |
65 | Permanent common bile duct obstruction with progressive liver disease manifest as persistent jaundice and hepatic insufficiency. |
75 | Permanent and irreparable common bile duct obstruction with advanced liver disease manifest as persistent jaundice and hepatic insufficiency. |
Note to Table 8.6
- Biliary tract dysfunction should only be assessed after cholecystectomy or other appropriate biliary tract surgery, except where there are sound medical reasons for not undertaking surgery.
Table 8.7: Hernias of the abdominal wall
See note to Table 8.7 immediately following the table.
% WPI | Criteria |
5 | Abdominal wall defect with slight protrusion of abdominal contents palpable with increased abdominal pressure, readily reducible. |
10 | Palpable abdominal wall defect with frequent or persistent protrusion of abdominal contents with increased abdominal pressure, manually reducible. |
25 | Palpable abdominal wall defect with persistent, irreducible or irreparable protrusion of abdominal contents at the site of defect, causing limitation of activities of daily living. |
Note to Table 8.7
- Hernias should be assessed only after surgical repair, except where there are sound medical reasons for repair not being undertaken.
9.0 Introduction
Part I
The lower extremities—feet and toes, ankles, knees and hips
Part I—Introduction
9.1 Feet and toes
9.2 Ankles
9.3 Knees
9.4 Hips
9.5 Lower extremity amputations
9.6 Spinal nerve root impairments and peripheral nerve injuries affecting
the lower extremities
9.6.1 Spinal nerve root impairment affecting the lower extremity
9.6.2 Peripheral nerve injuries affecting the lower extremities
9.7 Lower extremity function
Part II
The upper extremities—hands and fingers, wrists, elbows and shoulders
Part II—Introduction
9.8 Hands and fingers
9.8.1 Abnormal motion of digits
9.8.2 Sensory losses in the thumb and fingers
9.9 Wrists
9.10 Elbows
9.11 Shoulders
9.12 Upper extremity amputations
9.13 Neurological impairments affecting the upper extremities
9.13.1 Cervical nerve root impairment
9.13.2 Specific nerve lesions affecting the upper extremities
9.13.3 Complex eegional pain syndromes (CRPS)
9.14 Upper extremity function
Part III
The spine
Part III—Introduction
Part III—Definitions of clinical findings for diagnosis-related estimates in
assessing spinal impairment
Part III—Multi-level fractures involving the spinal canal
9.15 Cervical spine—diagnosis-related estimates
9.16 Thoracic spine—diagnosis-related estimates
9.17 Lumbar spine—diagnosis-related estimates
9.18 Fractures of the pelvis
In conducting an assessment, the assessor must have regard to the principles of assessment (see pages 23-26) and the definitions contained in the glossary (see pages 27-28).
Chapter 9 is divided into three parts:
- Part I—The lower extremities
- Part II—Upper extremities
- Part III—The spine.
The range of motion to be measured is the range of active motion. The medical assessor should be satisfied that the claimant is making an appropriate effort to demonstrate the maximal range and that the measurements are consistent (that is, several repetitions). The normal ranges of motion of individual joints in the musculoskeletal system are set out on the next page.
Peripheral vascular disease affecting lower and upper extremities is assessed under Table 1.4 and Table 1.5 (see Chapter 1—The cardiovascular system).
For the purposes of Chapter 9, activities of daily living are those in Figure 9-A (see below).
Figure 9-A: Activities of daily living
Activity | Examples |
Self care, personal hygiene | Bathing, grooming, dressing, eating, eliminating. |
Communication | Hearing, speaking, reading, writing, using keyboard. |
Physical activity | Standing, sitting, reclining, walking, stooping, squatting, kneeling, reaching, bending, twisting, leaning, carrying, lifting, pulling, pushing, climbing, exercising. |
Sensory function | Tactile feeling. |
Hand functions | Grasping, holding, pinching, percussive movements, sensory discrimination. |
Travel | Driving or travelling as a passenger. |
Sexual function | Participating in desired sexual activity. |
Sleep | Having a restful sleep pattern. |
Social and recreational | Participating in individual or group activities, sports activities, hobbies. |
Figure 9-B: Tables of normal ranges of motion of joints
Table | Joint | Plane | ROM from | ROM through | ROM to |
9.1 | Hindfoot/Ankle (subtalar) | Frontal | Eversion 20° | 0° | Inversion 30° |
9.2 | Ankle (talocrural) | Sagittal | Extension 20° | 0° | Flexion 40° |
9.3 | Knee | Sagittal | Extension 0° | | Flexion 150° |
9.4 | Hip | Rotation | External Rotation 50° | 0° | Internal Rotation 40° |
9.4 | Hip | Frontal | Abduction 40° | 0° | Adduction 20° |
9.4 | Hip | Sagittal | Extension 30° | 0° | Flexion 100° |
9.8.1.a | Thumb—IP joint | | Extension 30° | 0° | Flexion 80° |
9.8.1.a | Thumb—MP joint | | Extension 40° | 0° | Flexion 60° |
9.8.1.b | Thumb—radial abduction/adduction | | 15° (full radial adduction) | | 50° (full radial abduction) |
9.8.1.b | Thumb adduction | | 0 cm | | 8 cm |
9.8.1.b | Thumb opposition | | 0 cm | | 8 cm |
9.8.1.c | Index and middle fingers—DIP joint | | Extension 30° | 0° | Flexion 70° |
9.8.1.c | Index and middle fingers—PIP joint | | Extension 30° | 0° | Flexion 100° |
9.8.1.c | Index and middle fingers—MP joint | | Extension 20° | 0° | Flexion 90° |
9.8.1.d | Ring and little fingers—DIP joint | | Extension 30° | 0° | Flexion 70° |
9.8.1.d | Ring and little fingers—PIP joint | | Extension 30° | 0° | Flexion 100° |
9.8.1.d | Ring and little fingers—MP joint | | Extension 20° | 0° | Flexion 90° |
9.9.1.a | Wrist | Sagittal | Extension 60° | 0° | Flexion 60° |
9.9.1.b | Wrist | Frontal | Radial Deviation 20° | 0° | Ulnar deviation 30° |
9.10.1.a | Elbow | Sagittal | Extension 0° | 0° | Flexion 140° |
9.10.1.b | Elbow (forearm) | Rotation | Supination 80° | 0° | Pronation 80° |
Figure 9-B continued on following page.
Figure 9-B (continued)
9.11.1.a | Shoulder | Sagittal | Extension 40° | 0° | Flexion 180° |
9.11.1.b | Shoulder | Rotation | External rotation 90° | 0° | Internal Rotation 90° |
9.11.1.c | Shoulder | Frontal | Abduction 180° | 0° | Adduction 50° |
The impairments assessed for each region in the lower extremity are combined to obtain the overall impairment of the lower extremity for the individual extremity, subject to the notes accompanying the applicable tables, or any indication that combination is not permitted.
Where an arthroplasty procedure has been undertaken, refer to the American Medical Association’s Guides to the Evaluation of Permanent Impairment 5th edition 2001. Combine the total WPI rating for abnormal motion with the relevant WPI rating for arthroplasty, obtained from the American Medical Association’s Guide.
A WPI rating for one lower extremity may be combined with a WPI rating for the other lower extremity, except in the case of WPI ratings under Table 9.7: Lower extremity function (see page 122), where the notes accompanying Table 9.7 are followed.
WPI ratings from Table 9.1: Feet and Toes, Table 9.2: Ankles, Table 9.3: Knees or Table 9.4: Hips must not be combined with a WPI rating under Table 9.7 if they assess the same condition in the same lower extremity.
Where a condition cannot be assessed under one of Tables 9.1, 9.2, 9.3 and 9.4, an assessment may be made under the provisions of the American Medical Association’s Guides to the Evaluation of Permanent Impairment 5th edition 2001.
If the medical assessor considers that the impairment is not adequately assessed using one of Tables 9.1, 9.2, 9.3 and 9.4, and the condition does not cause a reduction in the range of motion of a joint but there is significant interference with gait, the medical assessor should consider the effect of the injury on gait and determine the WPI rating using Table 9.7. Table 9.7 cannot be used if the condition causes a reduction in the range of motion of a joint and an assessment can be made under any one or more of Table 9.1, 9.2, 9.3 or 9.4.
If permanent, conditions such as sesamoiditis, plantar fasciitis, plantar tendonitis, and pes planus, should be assessed under Table 9.7.
All ankylosis assessments from Tables 9.1, 9.2, 9.3 and 9.4 are alternative assessments to those for abnormal motion of the individual joints.
The maximum WPI rating for a single lower extremity in Tables 9.1, 9.2, 9.3 and 9.4 is 40%, including combined WPI ratings.
Complex regional pain syndrome in the lower extremities should be assessed using the same methodology as for the upper extremity substituting lower extremity table where appropriate. The diagnostic requirements of Figure 9-E apply.
Steps in calculating lower extremity impairment
Step 1 | Add abnormal motion/ankylosis impairment values within an individual joint. |
Step 2 | Combine abnormal motion/ankylosis impairment values for different joints in the toes. |
Step 3 | Add impairment values obtained for each individual toe and combine this value with the impairment values for other joints in the foot to obtain the total abnormal motion/ankylosis impairment assessment for a foot. |
Step 4 | Combine with abnormal motion/ankylosis impairment assessments for different regions in the lower extremity (that is, knee and hip). |
Step 5 | Combine with impairment values for peripheral nerve injuries. |
Step 6 | Combine with impairment values for amputation. |
Table 9.1 assesses impairments to range of motion of the feet and toes, including ankylosis of one or more joints. The maximum WPI rating under Table 9.1 is 2% for impairment of two or more of the 2nd, 3rd, 4th and 5th toes of one foot.
In the case of toes, the ankylosis referred to in Table 9.1 is that of the metatarso-phalangeal joint.
Ankylosis of the interphalangeal joints of the 2nd, 3rd, 4th or 5th toe attracts a WPI rating of 0. The position of function is the neutral position.
Table 9.1: Feet and toes
% WPI | Criteria (one required—different conditions may be assessed separately) |
0 | Ankylosis of any one of the 2nd, 3rd, 4th or 5th toes in position of function. |
1 | Interphalangeal flexion of the 1st toe restricted to less than 20. Metatarso-phalangeal extension of the 1st toe restricted to a range of 15-30. Metatarso-phalangeal extension of any one of the 2nd, 3rd, 4th and 5th toes restricted to less than 10. Subtalar inversion restricted to a range of 10-20. Subtalar eversion restricted to less than 10. |
| Ankylosis of: - any one of the 2nd, 3rd, 4th or 5th toes in full extension or full flexion
- any two of the 2nd, 3rd, 4th or 5th toes in position of function
- the 2nd, 3rd and 4th toes in position of function.
|
2 | Metatarso-phalangeal extension of the 1st toe restricted to less than 15. Metatarso-phalangeal extension of any two of the 2nd, 3rd, 4th or 5th toes restricted to less than 10 Subtalar inversion restricted to less than 10. |
Ankylosis of: - any two of the 2nd, 3rd or 4th toes, plus the 5th toe, in position of function
- any two of the 2nd, 3rd, 4th or 5th toes in full extension or full flexion
- all four of the 2nd, 3rd, 4th and 5th toes in position of function
- the 2nd toe with any two of the 3rd, 4th or 5th toes in full extension
- the 3rd, 4th and 5th toes in full extension or full flexion
- the 2nd and 3rd toes with either of the 4th or 5th toes in full flexion.
|
Table 9.1 (continued)
% WPI | Criteria (ONE required – different conditions may be assessed separately) |
3 | Ankylosis of: - all four of the 2nd, 3rd, 4th and 5th toes in full flexion or full extension
- the 2nd toe with the 4th and 5th toes in full flexion.
|
4 | Ankylosis of: - the 1st toe in position of function or full extension
- the 1st toe with any one of the 2nd, 3rd, 4th or 5th toes in position of function.
|
5 | Ankylosis of: - the 1st toe in full flexion
- the 1st toe with any one of the 2nd, 3rd, 4th or 5th toes in full extension
- the 1st toe with any two or three of the 2nd, 3rd, 4th or 5th toes in position of function.
|
6 | Ankylosis of: - the 1st toe with any two or three of the 2nd, 3rd, 4th or 5th toes in full extension
- the 1st toe with all four of the 2nd, 3rd, 4th and 5th toes in position of function
- the 1st toe with any one of the 2nd, 3rd, 4th or 5th toes in full flexion.
|
7 | Ankylosis of: - the 1st toe with any two of the 2nd, 3rd, 4th or 5th toes in full flexion
- the 1st toe with all four of the 2nd, 3rd, 4th and 5th toes in full extension.
|
8 | Ankylosis of the 1st toe with any three or all four of the 2nd, 3rd, 4th and 5th toes in full flexion. |
10 | Ankylosis of hindfoot with tibia-os calcis angle of 100 to 110. |
15 | Ankylosis of hindfoot with tibia-os calcis angle of 90 to 95. |
20 | Ankylosis of hindfoot with tibia-os calcis angle of less than 90. |
Table 9.2 assesses impairments to range of motion and deformity of the ankle, as well as ankylosis. Ankle deformity with movement is assessed separately from ankylosis.
Ankylosis in the optimal position is equivalent to a WPI of 4%. The optimal position is the neutral position without flexion, extension, varus or valgus. This is the base level of ankylosis impairment in the ankle.
When ankylosis is not in the optimal position, add the relevant WPI ratings from Table 9.2 for ankylosis in each direction. Then add the base figure of 4% WPI for ankylosis in the optimal position.
The maximum WPI rating for multiple impairments of the ankle and hindfoot is 25% WPI. If the total WPI rating obtained by adding different WPI ratings is higher than 25% WPI, then the final WPI rating for the ankle is 25%.
Table 9.2: Ankles
% WPI | Criteria (one required—different conditions may be assessed separately—but see notes on ankylosis above) |
3 | Plantar flexion capability restricted to 15-20. Dorsiflexion restricted to less than 10. |
4 | Ankylosis in optimal position only (see notes). |
| Deformity with: - varus angulation of 10
- valgus angulation of 10-20.
|
5 | Ankylosis not in optimal position: - in less than 10 of internal malrotation
- in 15of external malrotation.
|
6 | Plantar flexion capability restricted to 10 or less. Plantar flexion contracture of 10-15. |
7 | Ankylosis not in optimal position: - in 10 to 15 of dorsiflexion or plantar flexion.
|
| Deformity with varus angulation of 15-20. |
10 | Ankylosis not in optimal position: - in varus angulation of 5
- in valgus angulation of 10 to 15
- in 10 to 15 of internal malrotation
- in 20 to 25 of external malrotation
|
Table 9.2 continued on following page.
Table 9.2 (continued)
% WPI | Criteria (one required—different conditions may be assessed separately—but see notes on ankylosis above) |
12 | Plantar flexion contracture of at least 20. |
15 | Ankylosis not in optimal position: - in 20 to 25 of plantar flexion
- in at least 20 of dorsiflexion
- in varus angulation of 10 to 15
- in valgus angulation of 20 to 25
- in 20 to 25 of internal malrotation
- in 30 to 35 of external malrotation.
|
17 | Ankylosis not in optimal position: - in varus angulation of 20 to 25.
|
20 | Deformity with varus angulation of 25 or greater. |
21 | Ankylosis not in optimal position: - in varus angulation of at least 30
- in at least 30 of plantar flexion
- in valgus angulation of at least 30
- in at least 30 of internal malrotation
- in at least 40 of external malrotation.
|
Table 9.3 assesses impairments to range of motion and deformity of the knee, as well as ankylosis. Knee deformity with movement is assessed separately from ankylosis. ‘Deformity’ is measured by the femoral-tibial angle: 3-10 valgus is considered normal.
Ankylosis in the optimal position is equivalent to 27% WPI. The optimal position is 10-15 of flexion with good alignment. This is the base level of ankylosis impairment in the knee. When ankylosis is not in the optimal position, add the relevant WPI ratings from Table 9.3 for ankylosis in each direction. Then add the base figure of 27% WPI for ankylosis in the optimal position.
The maximum WPI rating for multiple impairments of the knee is 40% WPI. If the total WPI rating obtained by adding different WPI ratings is over 40%, then the final WPI rating for the knee is 40%.
Table 9.3: Knees
% WPI | Criteria (one required— different conditions may be assessed separately) |
| Flexion of 80-105. Flexion contracture of 5. Deformity with: - varus angulation of 2 valgus-0 (neutral)
- valgus angulation of 10-12.
|
5 | Ankylosis not in optimal position: - in 10 to 15 of internal malrotation
- in 10 to 15 of external malrotation
- in less than 10 of varus
- in 20 to 25 of flexion.
|
| Flexion of 60-75. Flexion contracture of 10-15. Deformity with: - varus angulation of 1-7
- valgus angulation of 13-15.
|
10 | Ankylosis not in optimal position: - in 20 to 25 of internal malrotation
- in 20 to 25 of external malrotation
- in 10 to 15 of varus
- in 20 to 25 of valgus
- in 30 to 35 of flexion.
|
13 | Ankylosis not in optimal position: - in at least 30 of internal malrotation
- in at least 30 of external malrotation
- in at least 20 of varus
- in at least 30 of valgus
- in at least 40 of flexion.
|
Table 9.3 continued on following page.
Table 9.3 (continued)
% WPI | Criteria (one required— different conditions may be assessed separately) |
14 | Flexion of 30-55. Flexion contracture of 20 or greater. Deformity with: - varus angulation of more than 12
- valgus angulation of more than 20.
|
20 | Flexion of less than 30. Deformity with: - varus angulation of more than 12
- valgus angulation of more than 20.
|
27 | Ankylosis in optimal position only (see notes above). |
Table 9.4 assesses impairments of range of motion and deformity of the hip, as well as ankylosis. Hip deformity with movement is assessed separately from ankylosis.
Ankylosis in the optimal position is 20% WPI. The optimal position is 25-40 of flexion with neutral rotation, abduction and adduction. This is the base level of ankylosis impairment in the hip. When ankylosis is not in the optimal position, add the relevant WPI ratings from Table 9.4 for ankylosis in each direction. Then add the base figure of 20% WPI for ankylosis in the optimal position.
The maximum WPI rating for multiple impairments of the hip is 40%. If the total WPI rating obtained by adding different WPI ratings is over 40%, then the final WPI rating for the hip is 40%.
Table 9.4: Hips
% WPI | Criteria (one required— different conditions may be assessed separately) |
2 | Flexion restricted to 80-100. Flexion contracture of 10-15. Internal rotation restricted to 10-15. External rotation restricted to 20-30. Abduction restricted to 15-25. Adduction restricted to 15 or less. Abduction contracture of 5 or less. |
5 | Flexion restricted to 50-70. Flexion contracture of 20-25. Internal rotation restricted to less than 10. External rotation restricted to less than 20. Abduction restricted to 5-10. Abduction contracture of 6-10. |
Ankylosis not in optimal position: - in 20 to 40 of flexion
- in at least 5 of internal rotation
- in 10-15 of external rotation.
|
Table 9.4 continued on following page.
Table 9.4 (continued)
% WPI | Criteria (one required— different conditions may be assessed separately) |
10 | Flexion restricted to less than 50. Flexion contracture of 30 or more. Abduction restricted to less than 5. Abduction contracture of 11-20. |
Ankylosis not in optimal position: - in 10 to 50 of flexion
- in at least 10 of internal rotation
- in at least 20 of external rotation
- in 5-10 of abduction
- in at least 5 of adduction.
|
15 | Abduction contracture of more than 20. |
Ankylosis not in optimal position: - in 0 to 60 of flexion
- in at least 20 of internal rotation
- in at least 30 of external rotation
- in 15-20 of abduction
- in at least 10 of adduction.
|
20 | Ankylosis in optimal position (see notes above). Ankylosis not in optimal position: - in at least 70 of flexion
- in at least 30 of internal rotation
- in at least 40 of external rotation
- in at least 25 of abduction
- in at least 15 of adduction.
|
Table 9.5 is the only table used to assess impairment arising from amputations in the lower extremity.
Table 9.7: Lower extremity function must not be used in cases involving amputations.
A WPI rating from Table 9.5 may be combined with other WPI ratings for lower extremity conditions above the amputation site.
Table 9.5: Lower extremity amputations
% WPI | Criteria (one required—different conditions may be assessed separately) |
0 | Amputation through: - interphalangeal joint (distal or proximal) of any one of 2nd, 3rd, 4th or 5th toes
- any phalanx of any one of the 2nd, 3rd, 4th or 5th toes.
Amputation of any portion of soft tissue of any toe. |
1 | Amputation of any one of the 2nd, 3rd, 4th or 5th toes at the metatarso-phalangeal joint. |
2 | Amputation of: - the first toe at the interphalangeal joint
- any toe except the first toe through the metatarsal
- any two of the 2nd, 3rd, 4th or 5th toes at the metatarso-phalangeal joint.
|
3 | Amputation of any three of the 2nd, 3rd, 4th and 5th toes at the metatarso-phalangeal joint. |
4 | Amputation of all four of the 2nd, 3rd, 4th and 5th toes at the metatarso-phalangeal joint. |
5 | Amputation of the first toe at the metatarso-phalangeal joint. |
8 | Amputation of the first metatarsal (first toe). |
10 | Amputation of all toes of one foot at the metatarso-phalangeal joints. |
16 | Transmetatarsal amputation. |
18 | Midfoot amputation. |
25 | Syme amputation of hindfoot. |
28 | Amputation of lower leg more than 7.5cm below knee. |
32 | Amputation of lower leg 7.5cm or less below knee. Knee disarticulation. Amputation above knee distal to midthigh. |
36 | Amputation above knee through midthigh. |
40 | Amputation above knee proximal to midthigh. Hip disarticulation. |
50 | Hemipelvectomy. |
Figure 9-C: Grading system
Grading | Sensory deficits or pain | Motor function |
Criteria | Criteria |
0 | No sensation or Severe pain that prevents all activity. | No contraction. |
1 | No protective sensibility with abnormal sensations or Severe pain that prevents most activity. | A flicker. |
2 | Decreased protective sensibility with abnormal sensations or Severe pain that prevents some activity. | Active movement with gravity eliminated. |
3 | Diminished light touch and two-point discrimination with some abnormal sensations or Slight pain that interferes with some activity. | Active movement against gravity. |
4 | Diminished light touch with or without minimal abnormal sensations or Pain that is forgotten during activity. | Active movement against gravity and resistance. |
5 | Normal sensation or No pain. | Normal power. |
Table 9.6.1 is to be used where there is involvement of a single spinal nerve. Where there are multiple nerves involved, the respective WPI ratings for each involved nerve should be combined.
Values obtained for pain, discomfort and/or sensory loss should be combined with values obtained for loss of strength, using the combined values chart (see Appendix 1).
Where the same nerve root is assessed, Table 9.6.1 must not be used in conjunction with Table 9.17: Lumbar spine.
Table 9.6.1: Spinal nerve root impairment affecting the lower extremity
| | Impairment causing pain, discomfort and/or sensory loss | | Impairment causing loss of strength | |
| | Grading | | Grading | |
| | | | | | | | | | | | | | | | | | | | | | |
| 5 | 4 | 3 | 2 | 1 | 0 | | 5 | 4 | 3 | 2 | 1 | 0 | | | |
| Nerve root | % WPI | | % WPI | Nerve root | |
| L3 | 0 | 1 | 1 | 2 | 3 | 3 | | 0 | 2 | 3 | 5 | 7 | 8 | L3 | |
| L4 | 0 | 1 | 1 | 2 | 3 | 3 | | 0 | 3 | 6 | 8 | 12 | 14 | L4 | |
| L5 | 0 | 1 | 1 | 2 | 3 | 3 | | 0 | 3 | 6 | 9 | 13 | 15 | L5 | |
| S1 | 0 | 1 | 1 | 2 | 3 | 3 | | 0 | 2 | 3 | 5 | 7 | 8 | S1 | |
| | | | | | | | | | | | | | | | | | | | | | |
WPI ratings obtained for sensory impairment should be combined with WPI ratings for dysaesthesia, and the total combined with WPI ratings for motor impairment, using the combined values chart (see Appendix 1).
Where the same nerve is assessed, Table 9.6.2a and Table 9.6.2b must not be used in conjunction with Table 9.17: Lumbar spine.
Use the grading system shown in Figure 9-C: Grading system.
Table 9.6.2a: Sensory impairment due to peripheral nerve injuries affecting the lower extremities
| Sensory grading | | Dysaesthesia grading | |
| | |
| 5 | 4 | 3 | 2 | 1 | 0 | | 5 | 4 | 3 | 2 | 1 | 0 | |
Nerve | % WPI | | % WPI | Nerve |
Femoral | 0 | 0 | 0 | 1 | 1 | 1 | | 0 | 1 | 1 | 2 | 3 | 3 | Femoral |
Lateral femoral cutaneous | 0 | 0 | 0 | 1 | 1 | 1 | | 0 | 1 | 1 | 2 | 3 | 3 | Lateral femoral cutaneous |
Sciatic | 0 | 1 | 3 | 5 | 6 | 7 | | 0 | 1 | 2 | 4 | 5 | 5 | Sciatic |
Common peroneal | 0 | 0 | 1 | 1 | 2 | 2 | | 0 | 0 | 1 | 1 | 2 | 2 | Common peroneal |
Tibial | 0 | 1 | 2 | 4 | 4 | 5 | | 0 | 1 | 1 | 3 | 3 | 3 | Tibial |
Superficial peroneal | 0 | 0 | 1 | 1 | 2 | 2 | | 0 | 0 | 1 | 1 | 2 | 2 | Superficial peroneal |
Sural | 0 | 0 | 0 | 1 | 1 | 1 | | 0 | 0 | 1 | 1 | 2 | 2 | Sural |
Medial plantar | 0 | 0 | 1 | 1 | 2 | 2 | | 0 | 0 | 1 | 1 | 2 | 2 | Medial plantar |
Lateral plantar | 0 | 0 | 1 | 1 | 2 | 2 | | 0 | 0 | 1 | 1 | 2 | 2 | Lateral plantar |
Table 9.6.2b: Motor impairment due to peripheral nerve injuries affecting the lower extremities
| Motor grading |
| 5 | 4 | 3 | 2 | 1 | 0 |
Nerve | % WPI |
Femoral | 0 | 3 | 6 | 9 | 13 | 15 |
Obturator | 0 | 1 | 1 | 2 | 3 | 3 |
Superior gluteal | 0 | 5 | 10 | 15 | 21 | 25 |
Inferior gluteal | 0 | 3 | 6 | 9 | 13 | 15 |
Sciatic | 0 | 6 | 12 | 18 | 26 | 30 |
Common peroneal | 0 | 3 | 6 | 9 | 13 | 15 |
Tibial | 0 | 3 | 6 | 9 | 13 | 15 |
Medial plantar | 0 | 0 | 1 | 1 | 2 | 2 |
Lateral plantar | 0 | 0 | 1 | 1 | 2 | 2 |
9.7 Lower extremity function
Table 9.7 (see following page) should only be used to assess impairment from objectively identified orthopaedic or neurological conditions arising in and affecting the lower extremities. It may not be used to assess impairment from conditions manifesting principally as pain with no clinically demonstrable lower extremity pathology.
A secondary dysfunction consequent to disuse is only assessable under Table 9.7 if this dysfunction is permanent (that is, not likely to improve as a result of surgery, medication or other rehabilitative treatment) and there are objective clinical findings that can be validly assessed using other tables in Chapter 9, Part 1—The lower extremities.
If permanent, conditions such as sesamoiditis, plantar fasciitis, plantar tendonitis, and pes planus, should be assessed under Table 9.7.
Table 9.7 must not be used in cases involving amputations.
A single assessment only may be made under Table 9.7, regardless of whether one or two extremities are affected by the injury. The impairment assessed under Table 9.7 is of overall lower extremity function, rather than that of individual extremities.
Before using Table 9.7 the medical assessor should check the instructions (see Part I—Introduction, page 106) preceding the specific joint impairment tables (Tables 9.1–9.4) and use Table 9.7 strictly in accordance with those instructions. In particular, Table 9.7 cannot be used where the condition causes a reduction in the range of motion of a joint and an assessment can be made under any one or more of Table 9.1, 9.2, 9.3 or 9.4.
Where only one limb is affected, regardless of the number of impairments found in that limb, the limb should be assessed using the relevant tables other than Table 9.7 and all impairments combined using the combined values table (see Appendix 1). The combined impairment rating should then be compared with the rating taken from the relevant row in Table 9.7 and the higher rating obtained from the two methods chosen.
Where both limbs are affected, each limb should be assessed using the relevant tables other than Table 9.7 and all impairments in both limbs combined using the combined values table (see Appendix 1). The combined impairment rating should then be compared with the rating taken from the relevant row in Table 9.7 and the higher rating obtained from the two methods chosen.
Table 9.7 may be used to assess lower extremity impairment arising as a result of spinal cord damage. Observe the special procedure set out in the introduction to Part III of this Chapter. However, Table 9.7 is not to be used to assess lower extremity impairment arising as a result of nerve root compression, or other neurological sequelae of other spinal conditions. These should be assessed under:
- Table 9.6.1, Table 9.6.2a or Table 9.6.2b (tables dealing with spinal nerve root impairments and peripheral nerve injuries affecting the lower extremities, see pages 98-100)
- Table 9.15: Cervical spine
- Table 9.16: Thoracic spine
- Table 9.17: Lumbar spine.
To fulfil the requirements of a WPI rating in Table 9.7, there must be one major criterion and at least two minor criteria present (where minor criteria are listed).
‘Manifest difficulty’ is difficulty (such as stumbling, or an altered gait) evident to the medical assessor. The difficulty must be tested clinically: history alone cannot be relied upon in the assessment.
Table 9.7: Lower extremity function
% WPI | Major criteria (at least one required) | Minor criteria (at least two required where listed) |
0 | Walks at a normal pace in comparison with peers on level ground or uneven ground and can avoid obstacles or Distance walked is not restricted by the condition being assessed (although other factors such as the level of fitness may cause restriction). | |
5 | Walks at a normal pace in comparison with peers on level ground but has manifest difficulty negotiating uneven ground and avoiding obstacles or Walking is restricted to 1000m or less (may be able to walk further after resting). | Legs give way or lock occasionally without causing falls. Can negotiate three or more stairs or a ramp (up and down) without the use of a walking aid or hand rails. |
10 | Walks at a normal pace in comparison with peers on level ground but is unable to negotiate uneven ground without use of a walking aid or personal assistant or Walking is restricted to 500m or less (may be able to walk further after resting). | Legs give way or lock occasionally without causing falls. Is unable to negotiate three or more stairs or a ramp (up and down) without the use of a walking aid or hand rails. |
20 | Walks at a moderately reduced pace in comparison with peers on level ground or Walking is restricted to 250m or less (may be able to walk further after resting). | Legs give way occasionally, causing falls. Is unable to negotiate three or more stairs or a ramp (up and down) without use of a walking aid or hand rails. Is unable to rise from sitting to standing position without use of one hand but can stand without support. |
Table 9.7 (continued)
% WPI | Major criteria (at least one required) | Minor criteria (at least two required where listed) |
30 | Walks at a significantly reduced pace in comparison with peers on level ground or Walking is restricted to 100m or less (may be able to walk further after resting). | Legs give way frequently, causing falls. Demonstrated medical need for a brace or walking aid (walking stick or crutches) on level ground. Is unable to negotiate three or more stairs or a ramp (up and down) without assistance from another person. Is unable to rise from sitting to standing position without use of both hands but can stand without support. |
40 | Walks at a greatly reduced pace in comparison with peers on level ground or Walking is restricted to 50m or less (may be able to walk further after resting). | Is restricted to walking around house and yard. Demonstrated medical need for a walking aid (walking stick or crutches) when walking on level ground. Is unable to negotiate three or more stairs or a ramp (up and down) under any circumstances. Is unable to rise from sitting to standing position without personal assistance and is unable to stand without support. |
50 | Walks at a very slow pace in comparison with peers on level ground or Walking is restricted to 25m or less (may be able to walk further after resting). | Is restricted to walking around house. Demonstrated medical need for a quad stick or walking frame as support when standing and walking. Is unable to negotiate any steps or ramps. Is unable to rise from sitting to standing position without personal assistance and is unable to stand without support. |
60 | Can stand with support of personal assistant but is unable to walk. | |
64 | Unable to stand or walk. | |
Part II—Introduction
The impairments assessed for each region in each upper extremity are combined (that is, hand, wrist, elbow, shoulder).
The WPI rating for one upper extremity may be combined with a WPI rating for the other upper extremity, except in the case of assessments under Table 9.14, where the notes appearing prior to Table 9.14 are to be followed.
WPI ratings from the following tables must not be combined with a WPI rating under Table 9.14 if they assess the same condition in the same upper extremity:
- Tables 9.8.1a, 9.8.1b, 9.8.1c, 9.8.1d (tables dealing with abnormal motion of digits)
- Tables 9.8.2a, 9.8.2b, 9.8.2c, 9.8.2d (tables dealing with sensory losses in thumb and fingers)
- Tables 9.9.1a, 9.9.1b (tables dealing with wrists)
- Tables 9.10.1a, 9.10.1b (tables dealing with elbows)
- Tables 9.11.1a, 9.11.1b, 9.11.1c (tables dealing with shoulders).
If the medical assessor considers that the impairment is not adequately assessed using one of Tables 9.9, 9.10, and 9.11, and the condition involves radiographically demonstrated joint instability, radiographically demonstrated arthritis or where the employee has had an arthroplasty, the medical assessor may consider the effect of the injury on upper extremity function instead and determine the WPI rating using Table 9.14. Table 9.14 cannot be used unless the condition involves radiographically demonstrated joint instability or arthritis or the employee has had an arthroplasty.
Where a condition cannot be assessed under a specific table in the upper extremities group, an assessment may be made under the provisions of the American Medical Association’s Guides to the Evaluation of Permanent Impairment 5th edition 2001.
All ankylosis assessments from tables in the upper extremities group are alternative assessments to those for abnormal motion of the individual joints.
The maximum WPI rating for a single upper extremity is 60%, including combined WPI ratings.
Steps in calculating upper extremity impairment
Note that sensory loss in the digit is assessed either as a digit impairment or as a peripheral nerve impairment as appropriate, but not both.
Step 1 | Add abnormal motion/ankylosis impairment values within an individual joint. |
Step 2 | Add abnormal motion/ankylosis impairment values for different joints in the thumb. |
Step 3 | Combine impairment values for different joints in the other four digits. |
Step 4 | Combine impairment values for each digit for sensory loss due to digital nerve injury and/or amputation. |
Step 5 | Add impairment values for each digit to obtain the total hand assessment. |
Step 6 | Combine with impairment values for different regions in the upper extremity. |
9.8 Hands and fingers
Add the WPI ratings for each individual digit to obtain the total WPI rating for the hand.
WPI ratings for abnormal motion or ankylosis of digits are combined with those for sensory losses in the same digits.
9.8.1 Abnormal motion of digits
Table 9.8.1a, Table 9.8.1b, Table 9.8.1c and Table 9.8.1d assess impairments to range of motion of the digits of the hand, including ankylosis of one or more joints.
Impairment values for flexion and extension losses in each individual joint are added to obtain the total WPI rating for loss of range of motion of that joint.
Where there is abnormal motion or ankylosis of more than one joint of the same finger, the WPI ratings for abnormal motion or ankylosis are combined to obtain the WPI rating for that finger.
Where there is abnormal motion or ankylosis of more than one joint of the thumb, the WPI ratings for abnormal motion or ankylosis are added to obtain the WPI rating for the thumb.
Table 9.8.1a: Abnormal motion/ankylosis of the thumb—IP and MP joints
See notes to Table 9.8.1a on page 131.
Direction | IP joint | MP joint | Direction |
Extension/ hyperextension | Ankylosis | Loss of extension | Loss of flexion | Ankylosis | Loss of extension | Loss of flexion | Extension/ hyperextension |
%WPI | %WPI | %WPI | %WPI | %WPI | %WPI |
| | | | 2 | 0 | 2 | 40 |
30 | 3 | 0 | 3 | 2 | 0 | 2 | 30 |
20 | 3 | 0 | 3 | 2 | 0 | 2 | 20 |
10 | 2 | 0 | 2 | 2 | 0 | 2 | 10 |
0 | 2 | 0 | 2 | 1 | 0 | 1 | 0 |
10 | 2 | 1 | 1 | 1 | 0 | 1 | 10 |
20 | 2 | 1 | 1 | 1 | 0 | 1 | 20 |
30 | 2 | 1 | 1 | 1 | 1 | 1 | 30 |
40 | 2 | 2 | 1 | 2 | 1 | 1 | 40 |
50 | 2 | 2 | 1 | 2 | 2 | 0 | 50 |
60 | 3 | 2 | 0 | 2 | 2 | 0 | 60 |
70 | 3 | 3 | 0 | | | | |
80 | 3 | 3 | 0 | | | | |
Flexion | | | | | | | Flexion |
Table 9.8.1b: Radial abduction/adduction/opposition of the thumb—abnormal motion/ankylosis
See notes to Table 9.8.1b on page 131.
% WPI | Criteria (one required—different conditions may be assessed separately) |
0 | Loss of less than 10 of radial adduction. Loss of less than 35 of radial abduction. Lack of less than 3cm adduction. Thumb opposition of more than 6 cm. |
1 | Loss of 10-20 of radial adduction. Loss of 35-40 of radial abduction. Lack of 3-5 cm adduction. Thumb opposition of 5 to 6 cm. Ankylosis in 30 to 35 of radial abduction. |
2 | Loss of 25 or more of radial adduction. Loss of 45 or more of radial abduction. Lack of 6cm adduction. Ankylosis in 15-25, or 40-50 of radial abduction. Ankylosis in 4cm of adduction. Thumb opposition of 4cm. |
3 | Lack of 7cm adduction. Thumb opposition of 3cm. Ankylosis in 3cm or 5cm of adduction. |
4 | Lack of 8cm adduction. Ankylosis in 0-2cm or 6-8cm of adduction. |
5 | Thumb opposition of 2cm. Ankylosis in thumb opposition of 5-6cm. |
6 | Ankylosis in thumb opposition of 4cm or 7cm. |
7 | Thumb opposition of 1cm. Ankylosis in thumb opposition of 3cm or 8cm. |
8 | Ankylosis in thumb opposition of 1 or 2cm. |
10 | Thumb opposition of 0cm. Ankylosis in thumb opposition of 0cm. |
Table 9.8.1c: Abnormal motion/ankylosis of the fingers—index and middle fingers
See notes to Table 9.8.1c on page 131.
Direction | Index and middle fingers | Direction |
Extension/hyperextension | DIP joint | PIP joint | MP joint | Extension/hyperextension |
Ankylosis | Loss of extension | Loss of flexion | Ankylosis | Loss of extension | Loss of flexion | Ankylosis | Loss of extension | Loss of flexion |
%WPI | %WPI | %WPI | %WPI | %WPI | %WPI | %WPI | %WPI | %WPI |
30 | 5 | 0 | 5 | 8 | 0 | 8 | | | | 30 |
20 | 4 | 0 | 4 | 8 | 0 | 8 | 7 | 0 | 7 | 20 |
10 | 4 | 0 | 4 | 7 | 0 | 7 | 6 | 1 | 6 | 10 |
0 | 4 | 0 | 4 | 7 | 0 | 7 | 6 | 1 | 5 | 0 |
10 | 4 | 0 | 3 | 6 | 1 | 6 | 5 | 1 | 5 | 10 |
20 | 3 | 1 | 3 | 6 | 1 | 5 | 5 | 1 | 4 | 20 |
30 | 4 | 1 | 2 | 6 | 1 | 4 | 5 | 1 | 4 | 30 |
40 | 4 | 2 | 2 | 5 | 2 | 4 | 6 | 3 | 3 | 40 |
50 | 4 | 3 | 1 | 6 | 3 | 3 | 7 | 4 | 2 | 50 |
60 | 4 | 4 | 1 | 7 | 4 | 3 | 8 | 6 | 2 | 60 |
70 | 5 | 5 | 0 | 7 | 5 | 2 | 8 | 8 | 1 | 70 |
80 | | | | 8 | 7 | 1 | 10 | 9 | 1 | 80 |
90 | | | | 8 | 8 | 1 | 11 | 11 | 0 | 90 |
100 | | | | 8 | 8 | 0 | | | | 100 |
Flexion | | | | | | | | | | Flexion |
Table 9.8.1d: Abnormal motion/ankylosis of the fingers—ring and little fingers
See notes to Table 9.8.1d on page 131.
Direction | Ring and little fingers | Direction |
Extension/hyperextension | DIP joint | PIP joint | MP joint | Extension/hyperextension |
Ankylosis | Loss of extension | Loss of flexion | Ankylosis | Loss of extension | Loss of flexion | Ankylosis | Loss of extension | Loss of flexion |
%WPI | %WPI | %WPI | %WPI | %WPI | %WPI | %WPI | %WPI | %WPI |
30 | 3 | 0 | 3 | 4 | 0 | 4 | | | | 30 |
20 | 2 | 0 | 2 | 4 | 0 | 4 | 3 | 0 | 3 | 20 |
10 | 2 | 0 | 2 | 4 | 0 | 4 | 3 | 0 | 3 | 10 |
0 | 2 | 0 | 2 | 3 | 0 | 3 | 3 | 1 | 3 | 0 |
10 | 2 | 0 | 2 | 3 | 0 | 3 | 3 | 1 | 2 | 10 |
20 | 2 | 0 | 2 | 3 | 1 | 3 | 3 | 1 | 2 | 20 |
30 | 2 | 1 | 1 | 3 | 1 | 2 | 3 | 1 | 2 | 30 |
40 | 2 | 1 | 1 | 3 | 1 | 2 | 3 | 2 | 2 | 40 |
50 | 2 | 2 | 1 | 3 | 2 | 2 | 3 | 2 | 1 | 50 |
60 | 2 | 2 | 1 | 3 | 2 | 1 | 4 | 3 | 1 | 60 |
70 | 3 | 3 | 0 | 4 | 3 | 1 | 4 | 4 | 1 | 70 |
80 | | | | 4 | 3 | 1 | 5 | 5 | 1 | 80 |
90 | | | | 4 | 4 | 1 | 5 | 5 | 0 | 90 |
100 | | | | 4 | 4 | 0 | | | | 100 |
Flexion | | | | | | | | | | Flexion |
Notes to Tables 9.8.1a, 9.8.1b, 9.8.1c and 9.8.1d
- Abbreviations:
IP = interphalangeal.
MP = metacarpo-phalangeal.
CMC = carpometacarpal.
PIP = Proximal interphalangeal.
DIP = Distal interphalangeal.
2. Thumb adduction is the smallest possible distance from the flexor crease of the IP joint of the thumb to the distal palmar crease over the level of the MP joint of the little finger. The normal range of adduction of the thumb is from 8 cm to 0cm.
3. Thumb radial abduction is the largest angle of separation actively formed between the first and second metacarpals in the coronal plane. The normal angle of radial abduction is 50. The smallest angle of thumb radial adduction is 15.
4. Opposition of the thumb is measured as the largest achievable distance between the flexor crease of the IP joint of the thumb to the distal palmar crease directly over the third MP joint. The normal range of opposition of the thumb is from 0 cm to 8 cm. In the case of employees with small hands, compare the loss of opposition with the normal range of opposition in the unaffected hand.
5. Optimal positions of thumb and fingers:
Joint | Optimal position | | Joint | Optimal position |
Thumb IP | 20 of flexion | | Finger DIP | 20 of flexion |
Thumb MP | 20 of flexion | | Finger PIP | 40 of flexion |
Thumb CMC | 30-35 of radial abduction | | Finger MP | 30 of flexion |
9.8.2 Sensory losses in the thumb and fingers
Table 9.8.2a, Table 9.8.2b, Table 9.8.2c, and Table 9.8.2d (see following page) assess sensory losses in the thumb and fingers due to digital nerve lesions only.
Sensory losses due to peripheral nerve lesions are assessed under Tables 9.13.1, 9.13.2a and 9.13.2b (tables dealing with neurological impairments affecting the upper extremities).
The two-point discrimination test is used to determine sensory loss:
- Total sensory loss = two-point discrimination of greater than 15mm
- Partial sensory loss = two-point discrimination of 7 to 15mm.
Two-point discrimination of less than 7 mm is not treated as an impairment.
Transverse sensory loss involves both digital nerves (ulnar and radial). Longitudinal sensory loss involves a single digital nerve (ulnar or radial).
Determine the percentage of digit length involved using the method in the American Medical Association’s Guides to the Evaluation of Permanent Impairment 5th edition 2001 and consult Table 9.8.2a, Table 9.8.2b, Table 9.8.2c, and Table 9.8.2d, using the corresponding WPI rating for the nerve or nerves involved.
WPI ratings for transverse sensory loss must not be combined with WPI ratings for longitudinal sensory loss in the same digit. The conditions of transverse sensory loss and longitudinal sensory loss in an individual digit are mutually exclusive.
WPI ratings for sensory losses in digits are combined with those for abnormal motion or ankylosis in the same digits.
For the thumb and little finger, losses involving the ulnar digital nerve are rated higher than those of the radial digital nerve. For the other fingers, losses involving the radial digital nerve are rated higher than those of the ulnar digital nerve.
If the little finger has been amputated, the ring finger is assessed as if it were the little finger.
Table 9.8.2a: Sensory losses in the thumb Table 9.8.2b: Sensory losses in the
index and middle fingers
Percentage of digit length | % WPI (thumb) | | Percentage of digit length | % WPI (index and middle fingers) |
Transverse loss | Longitudinal loss | | Transverse loss | Longitudinal loss |
Both digital nerves | Ulnar digital nerve | Radial digital nerve | | Both digital nerves | Ulnar digital nerve | Radial digital nerve |
Total | Partial | Total | Partial | Total | Partial | | Total | Partial | Total | Partial | Total | Partial |
10 | 1 | 1 | 1 | 1 | 1 | 0 | | 10 | 1 | 1 | 0 | 0 | 1 | 0 |
20 | 2 | 1 | 1 | 1 | 1 | 1 | | 20 | 1 | 1 | 1 | 0 | 1 | 1 |
30 | 3 | 2 | 2 | 1 | 1 | 1 | | 30 | 2 | 1 | 1 | 1 | 1 | 1 |
40 | 4 | 2 | 3 | 1 | 2 | 1 | | 40 | 2 | 1 | 1 | 1 | 1 | 1 |
50 | 5 | 3 | 3 | 2 | 2 | 1 | | 50 | 3 | 2 | 1 | 1 | 2 | 1 |
60 | 7 | 3 | 4 | 2 | 3 | 1 | | 60 | 3 | 2 | 1 | 1 | 2 | 1 |
70 | 8 | 4 | 4 | 2 | 3 | 2 | | 70 | 4 | 2 | 2 | 1 | 2 | 1 |
80 | 8 | 4 | 5 | 3 | 3 | 2 | | 80 | 4 | 2 | 2 | 1 | 3 | 1 |
90 | 10 | 5 | 6 | 3 | 4 | 2 | | 90 | 5 | 3 | 2 | 1 | 3 | 2 |
100 | 11 | 5 | 7 | 3 | 4 | 2 | | 100 | 5 | 3 | 2 | 1 | 3 | 2 |
Table 9.8.2c: Sensory losses in the little Table 9.8.2d: Sensory losses in the finger ring finger
Percentage of digit length | % WPI (little finger) | | Percentage of digit length | % WPI (ring finger) |
Transverse loss | Longitudinal loss | | Transverse loss | Longitudinal loss |
Both digital nerves | Ulnar digital nerve | Radial digital nerve | | Both digital nerves | Ulnar digital nerve | Radial digital nerve |
Total | Partial | Total | Partial | Total | Partial | | Total | Partial | Total | Partial | Total | Partial |
10 | 1 | 0 | 0 | 0 | 0 | 0 | | 10 | 1 | 0 | 0 | 0 | 0 | 0 |
20 | 1 | 1 | 1 | 0 | 0 | 0 | | 20 | 1 | 1 | 0 | 0 | 1 | 0 |
30 | 1 | 1 | 1 | 1 | 1 | 0 | | 30 | 1 | 1 | 1 | 0 | 1 | 1 |
40 | 1 | 1 | 1 | 1 | 1 | 0 | | 40 | 1 | 1 | 1 | 0 | 1 | 1 |
50 | 2 | 1 | 1 | 1 | 1 | 1 | | 50 | 2 | 1 | 1 | 1 | 1 | 1 |
60 | 2 | 1 | 1 | 1 | 1 | 1 | | 60 | 2 | 1 | 1 | 1 | 1 | 1 |
70 | 2 | 1 | 1 | 1 | 1 | 1 | | 70 | 2 | 1 | 1 | 1 | 1 | 1 |
80 | 2 | 1 | 1 | 1 | 1 | 1 | | 80 | 2 | 1 | 1 | 1 | 1 | 1 |
90 | 3 | 1 | 2 | 1 | 1 | 1 | | 90 | 3 | 1 | 1 | 1 | 2 | 1 |
100 | 3 | 2 | 2 | 1 | 1 | 1 | | 100 | 3 | 2 | 1 | 1 | 2 | 1 |
9.9 Wrists
Table 9.9.1a and Table 9.9.1b (both on following page) assess impairments to range of motion of the wrists, including ankylosis.
Loss of range of motion in each functional plane is measured from the neutral position. The range of motion is expressed as the two achievable limits of active motion in each direction through the normal range of motion. It is possible that the only motion that can be achieved is between two points on one side of the neutral position.
The WPI rating for restriction of motion in one direction is determined according to the active motion than can be achieved in that direction. It is then added to the WPI rating for the active motion in the reverse direction.
Add the abnormal motion WPI ratings for each direction of motion for both wrist flexion/extension and radial/ulnar deviation. Where there is ankylosis, including after an arthrodesis procedure, the assessment should be made only under the ankylosis scale.
Where an arthroplasty procedure has been undertaken, refer to the American Medical Association’s Guides to the Evaluation of Permanent Impairment 5th edition 2001. Combine the total WPI rating for abnormal motion with the relevant WPI rating for arthroplasty, obtained from the American Medical Association’s Guides.
For ankylosis, the optimal position for arthrodesis of the wrist is approximately 15-20 of dorsiflexion with slight ulnar deviation.
The maximum possible wrist impairment is 35% WPI.
For the same condition, a WPI rating from Table 9.9.1a or Table 9.9.1b may not be combined with a WPI rating from Table 9.14: Upper extremity function.
Table 9.9.1a: Wrist flexion/extension
Direction | Ankylosis | Loss of extension | Loss of flexion | Direction |
Extension | %WPI | %WPI | %WPI | Extension |
60 | 25 | 0 | 25 | 60 |
50 | 22 | 1 | 22 | 50 |
40 | 17 | 2 | 15 | 40 |
30 | 16 | 3 | 13 | 30 |
20 | 14 | 4 | 10 | 20 |
10 | 13 | 5 | 8 | 10 |
0 | 13 | 7 | 6 | 0 |
10 | 13 | 8 | 5 | 10 |
20 | 15 | 11 | 4 | 20 |
30 | 17 | 14 | 3 | 30 |
40 | 20 | 18 | 2 | 40 |
50 | 23 | 22 | 1 | 50 |
60 | 25 | 25 | 0 | 60 |
Flexion | | | | Flexion |
Table 9.9.1b: Radial and ulnar deviation of wrist joint
Direction | Ankylosis | Loss of radial deviation | Loss of ulnar deviation | Direction |
Radial deviation | %WPI | %WPI | %WPI | Radial deviation |
20 | 11 | 0 | 11 | 20 |
15 | 10 | 1 | 9 | 15 |
10 | 8 | 1 | 7 | 10 |
5 | 7 | 2 | 5 | 5 |
0 | 5 | 2 | 3 | 0 |
5 | 5 | 3 | 2 | 5 |
10 | 5 | 3 | 2 | 10 |
15 | 7 | 5 | 2 | 15 |
20 | 8 | 7 | 1 | 20 |
25 | 10 | 9 | 1 | 25 |
30 | 11 | 11 | 0 | 30 |
Ulnar deviation | | | | Ulnar deviation |
9.10 Elbows
Table 9.10.1 and Table 9.10.1b (both on following page) assess impairments to range of motion of the elbows, including ankylosis.
Loss of range of motion in each functional plane is measured from the neutral position. The range of motion is expressed as the two achievable limits of active motion in each direction through the normal range of motion. It is possible that the only motion that can be achieved is between two points on one side of the neutral position.
The WPI rating for restriction of motion in one direction is determined according to the active motion than can be achieved in that direction. It is then added to the WPI rating for the active motion in the reverse direction.
Add the abnormal motion WPI rating for each direction of motion for both elbow flexion/extension and pronation/supination. Where there is ankylosis, including after an arthrodesis procedure, the assessment should be made only under the ankylosis scale.
Where an arthroplasty procedure has been undertaken, refer to the American Medical Association’s Guides to the Evaluation of Permanent Impairment 5th edition 2001. Combine the total WPI rating for abnormal motion with the relevant WPI rating for arthroplasty, obtained from the American Medical Association’s Guides.
For ankylosis, the optimal or functional position is 80 of flexion and 20 of pronation.
The maximum possible elbow impairment is 40% WPI.
For the same condition, a WPI rating from Table 9.10.1a or Table 9.10.1b may not be combined with a WPI rating from Table 9.14: Upper extremity function.
Table 9.10.1a: Elbow flexion/extension
Direction | Ankylosis | Loss of extension | Loss of flexion | Direction |
Flexion | %WPI | %WPI | %WPI | Flexion |
140 | 25 | 25 | 0 | 140 |
130 | 23 | 22 | 1 | 130 |
120 | 20 | 19 | 1 | 120 |
110 | 19 | 16 | 2 | 110 |
100 | 16 | 13 | 4 | 100 |
90 | 15 | 10 | 5 | 90 |
80 | 13 | 7 | 6 | 80 |
70 | 14 | 5 | 9 | 70 |
60 | 15 | 4 | 11 | 60 |
50 | 17 | 3 | 14 | 50 |
40 | 19 | 2 | 16 | 40 |
30 | 20 | 2 | 19 | 30 |
20 | 22 | 1 | 20 | 20 |
10 | 23 | 1 | 22 | 10 |
0 | 25 | 0 | 25 | 0 |
Extension | | | | Extension |
Table 9.10.1b: Pronation and supination of forearm
Direction | Ankylosis | Loss of pronation | Loss of supination | Direction |
Supination | %WPI | %WPI | %WPI | Supination |
80 | 17 | 17 | 0 | 80 |
70 | 16 | 16 | 0 | 70 |
60 | 16 | 15 | 1 | 60 |
50 | 15 | 14 | 1 | 50 |
40 | 14 | 13 | 1 | 40 |
30 | 14 | 13 | 1 | 30 |
20 | 13 | 11 | 2 | 20 |
10 | 11 | 9 | 2 | 10 |
0 | 9 | 7 | 2 | 0 |
10 | 7 | 5 | 2 | 10 |
20 | 5 | 2 | 2 | 20 |
30 | 5 | 2 | 4 | 30 |
40 | 7 | 2 | 5 | 40 |
50 | 9 | 1 | 8 | 50 |
60 | 11 | 1 | 11 | 60 |
70 | 14 | 1 | 13 | 70 |
80 | 17 | 0 | 17 | 80 |
Pronation | | | | Pronation |
Table 9.11.1a, Table 9.11.1b and Table 9.11.1c assess impairments to range of motion of the shoulders, including ankylosis.
Loss of range of motion in each functional plane is measured from the neutral position. The range of motion is expressed as the two achievable limits of active motion in each direction through the normal range of motion. It is possible that the only motion that can be achieved is between two points on one side of the neutral position.
The WPI rating for restriction of motion in one direction is determined according to the active motion than can be achieved in that direction. It is then added to the WPI rating for the active motion in the reverse direction.
Add the abnormal motion WPI ratings for each direction of motion for shoulder flexion/extension, abduction/adduction and internal/external rotation. Where there is ankylosis, including after an arthrodesis procedure, the assessment should only be made under the ankylosis scale.
Where an arthroplasty procedure has been undertaken, refer to the American Medical Association’s Guides to the Evaluation of Permanent 5th edition 2001. Combine the total WPI rating for abnormal motion with the relevant WPI rating for arthroplasty, obtained from the American Medical Association’s Guides.
For ankylosis, the optimal or functional position is 20-40 of flexion, 20-50 of abduction and 30-50 of internal rotation. Unless the shoulder has been arthrodesed, an assessment for ankylosis under this table would be rare.
The maximum possible shoulder impairment is 35% WPI.
For the same condition, a WPI rating from Table 9.11.1a, Table 9.11.1b or Table 9.11.1c may not be combined with a WPI rating from Table 9.14: Upper extremity function.
Table 9.11.1a: Shoulder flexion/extension
Direction | Ankylosis | Loss of extension | Loss of flexion | Direction |
Flexion | %WPI | %WPI | %WPI | Flexion |
180 | 18 | 18 | 0 | 180 |
170 | 18 | 17 | 1 | 170 |
160 | 17 | 17 | 1 | 160 |
150 | 17 | 16 | 1 | 150 |
140 | 17 | 16 | 2 | 140 |
130 | 17 | 15 | 2 | 130 |
120 | 17 | 14 | 2 | 120 |
110 | 17 | 14 | 3 | 110 |
100 | 16 | 13 | 3 | 100 |
90 | 16 | 13 | 4 | 90 |
80 | 15 | 11 | 4 | 80 |
70 | 13 | 9 | 4 | 70 |
60 | 12 | 7 | 5 | 60 |
50 | 10 | 5 | 5 | 50 |
40 | 9 | 3 | 6 | 40 |
30 | 9 | 3 | 6 | 30 |
20 | 9 | 2 | 7 | 20 |
10 | 11 | 2 | 10 | 10 |
0 | 14 | 2 | 13 | 0 |
10 | 15 | 1 | 14 | 10 |
20 | 16 | 1 | 14 | 20 |
30 | 16 | 1 | 16 | 30 |
40 | 17 | 1 | 17 | 40 |
50 | 18 | 0 | 18 | 50 |
Extension | | | | Extension |
Table 9.11.1b: Shoulder—internal/external rotation
Direction | Ankylosis | Loss of external rotation | Loss of internal rotation | Direction |
External rotation | %WPI | %WPI | %WPI | External rotation |
90 | 7 | 0 | 7 | 90 |
80 | 7 | 0 | 7 | 80 |
70 | 7 | 0 | 7 | 70 |
60 | 6 | 0 | 6 | 60 |
50 | 6 | 1 | 5 | 50 |
40 | 5 | 1 | 5 | 40 |
30 | 5 | 1 | 5 | 30 |
20 | 5 | 1 | 4 | 20 |
10 | 5 | 1 | 4 | 10 |
0 | 4 | 1 | 3 | 0 |
10 | 4 | 1 | 3 | 10 |
20 | 4 | 1 | 2 | 20 |
30 | 4 | 1 | 2 | 30 |
40 | 4 | 2 | 2 | 40 |
50 | 4 | 2 | 1 | 50 |
60 | 4 | 3 | 1 | 60 |
70 | 5 | 5 | 1 | 70 |
80 | 6 | 6 | 0 | 80 |
90 | 7 | 7 | 0 | 90 |
Internal rotation | | | | Internal rotation |
Table 9.11.1c: Abduction/adduction of shoulder
Direction | Ankylosis | Loss of adduction | Loss of abduction | Direction |
Abduction | %WPI | %WPI | %WPI | Abduction |
180 | 11 | 11 | 0 | 180 |
170 | 11 | 11 | 0 | 170 |
160 | 10 | 10 | 1 | 160 |
150 | 10 | 10 | 1 | 150 |
140 | 10 | 9 | 1 | 140 |
130 | 10 | 9 | 1 | 130 |
120 | 10 | 8 | 2 | 120 |
110 | 10 | 8 | 2 | 110 |
100 | 10 | 7 | 2 | 100 |
90 | 10 | 7 | 2 | 90 |
80 | 8 | 5 | 3 | 80 |
70 | 7 | 4 | 3 | 70 |
60 | 7 | 3 | 3 | 60 |
50 | 5 | 2 | 3 | 50 |
40 | 5 | 2 | 3 | 40 |
30 | 5 | 1 | 4 | 30 |
20 | 5 | 1 | 7 | 20 |
10 | 7 | 1 | 6 | 10 |
0 | 8 | 1 | 7 | 0 |
10 | 9 | 1 | 8 | 10 |
20 | 10 | 1 | 9 | 20 |
30 | 10 | 1 | 10 | 30 |
40 | 10 | 0 | 10 | 40 |
50 | 11 | 0 | 11 | 50 |
Adduction | | | | Adduction |
9.12 Upper extremity amputations
Total loss of hand function is equivalent to amputation of the whole hand and attracts a WPI rating of 54%.
Table 9.14: Upper extremity function must not be used for amputations.
Table 9.12.1: Upper extremity amputations
% WPI | Criteria |
54 | Amputation of thumb and all fingers through metacarpals. |
56 | Amputation at wrist or between wrist and distal to bicipital insertion. |
57 | Amputation from distal to deltoid insertion to bicipital insertion. |
60 | Amputation of arm at deltoid insertion and proximally or Amputation at shoulder. |
70 | Forequarter amputation. |
Table 9.12.2: Amputation of digits
%WPI | Thumb | | Fingers | %WPI |
| Index and middle | Ring and little |
2 | Tip of thumb excluding bone. | | Tip of finger excluding bone. | 1 | 1 |
7 | Through distal phalanx. | | Through distal phalanx. | 3 | 2 |
11 | Through IP joint. | | Through distal IP joint. | 5 | 3 |
17 | Through proximal phalanx. | | Through middle phalanx. | 7 | 4 |
22 | Through MP joint. | | Through proximal IP joint. | 8 | 4 |
22 | Through distal third of 1st metacarpal. | | Through proximal phalanx. | 10 | 5 |
23 | At or near the CMC joint. | | Through MP joint or metacarpal. | 11 | 5 |
9.13 Neurological impairments affecting the upper extremities
Sensory impairments due to digital nerve lesions alone are assessed under Table 9.8.2a, Table 9.8.2b, Table 9.8.2c, and Table 9.8.2d (tables dealing with sensory losses in thumb and fingers, see page 134-135).
Care must be taken to avoid duplicating impairment assessments for digital nerve sensory impairment with assessments for peripheral nerve sensory impairment. Assessments for digital nerve sensory impairment are assessed under Tables 9.8.2a, 9.8.2b, 9.8.2c, and 9.8.2d. Assessments for peripheral nerve sensory impairment are assessed under Tables 9.13.1, 9.13.2a, and 9.13.2b.
For sensory impairment in the same digit, WPI ratings obtained from Table 9.13.1, Table 9.13.2a, and Table 9.13.2b, must not be combined with WPI ratings from Tables 9.8.2a, 9.8.2b, 9.8.2c, and 9.8.2d.
The grading system set out in Figure 9-D: Grading system (see below) is to be used with Table 9.13.1, Table 9.13.2a, and Table 9.13.2b.
Figure 9-D: Grading system
See note immediately following Figure 9-D.
Grading | Sensory deficits or pain criteria | Motor function criteria |
0 | No sensation or Severe pain that prevents all activity. | No contraction. |
1 | No protective sensibility with abnormal sensations or Severe pain that prevents most activity. | A flicker. |
2 | Decreased protective sensibility with abnormal sensations or Severe pain that prevents some activity. | Active movement with gravity eliminated. |
3 | Diminished light touch AND two-point discrimination with some abnormal sensations or Slight pain that interferes with some activity. | Active movement against gravity. |
4 | Diminished light touch with or without minimal abnormal sensations or Pain that is forgotten during activity. | Active movement against gravity and resistance. |
5 | Normal sensation or No pain. | Normal power. |
Note to Figure 9-D
- Figure 9-D also appears in Section 9.6—Spinal nerve root impairments and peripheral nerve injuries affecting the lower extremities as Figure 9-C. It is repeated here for ease of reference.
9.13.1 Cervical nerve root impairment
Use the appropriate section of Table 9.13.1, depending on whether there is involvement of a single spinal nerve, the brachial plexus, or combined nerve root impairment.
WPI ratings for sensory impairment should be combined with those for motor impairment, using the combined values chart (see Appendix 1). Table 9.13.1 must not be used in conjunction with Table 9.15: Cervical spine where the same nerve is assessed under that table.
The maximum WPI rating for one upper extremity is 60%. A WPI of 60% may be awarded either:
- for complete brachial plexus sensory loss
- brachial plexus motor loss
but these cannot be combined to give a WPI rating greater than 60% for the one upper extremity.
Table 9.13.1: Cervical nerve root impairment
| Single nerve involvement | | Single nerve involvement | |
| Sensory impairment | | Motor impairment | |
| Grading | | Grading | |
| 5 | 4 | 3 | 2 | 1 | 0 | | 5 | 4 | 3 | 2 | 1 | 0 | |
Nerve root | % WPI | | % WPI | Nerve root |
C5 | 0 | 1 | 1 | 2 | 3 | 3 | | 0 | 2 | 7 | 11 | 15 | 18 | C5 |
C6 | 0 | 1 | 2 | 4 | 5 | 5 | | 0 | 4 | 8 | 13 | 18 | 21 | C6 |
C7 | 0 | 1 | 1 | 2 | 3 | 3 | | 0 | 4 | 8 | 13 | 18 | 21 | C7 |
C8 | 0 | 1 | 1 | 2 | 3 | 3 | | 0 | 5 | 11 | 16 | 23 | 27 | C8 |
T1 | 0 | 1 | 1 | 2 | 3 | 3 | | 0 | 2 | 5 | 7 | 10 | 12 | T1 |
| | | | | | | | | | | | | | |
| Brachial plexus involvement or combined nerve root impairment | | Brachial plexus involvement or combined nerve root impairment | |
| Sensory impairment | | Motor impairment | |
| Grading | | Grading | |
| 5 | 4 | 3 | 2 | 1 | 0 | | 5 | 4 | 3 | 2 | 1 | 0 | |
Nerves or nerve roots | % WPI | | % WPI | Nerves or nerve roots |
Complete brachial plexus (C5 to T1 inclusive) | 0 | 12 | 24 | 42 | 54 | 60 | | 0 | 12 | 24 | 36 | 51 | 60 | Complete brachial plexus (C5 to T1 inclusive) |
Upper trunk of brachial plexus (C5, C6, Erb-Duchenne) | 0 | 3 | 6 | 11 | 14 | 15 | | 0 | 9 | 18 | 27 | 38 | 45 | Upper trunk of brachial plexus (C5, C6, Erb-Duchenne) |
Middle trunk of brachial plexus (C7) | 0 | 1 | 1 | 2 | 3 | 3 | | 0 | 4 | 8 | 13 | 18 | 21 | Middle trunk of brachial blexus (C7) |
Lower trunk of brachial plexus (C8, T1, Déjerine-Klumpke) | 0 | 2 | 5 | 8 | 11 | 12 | | 0 | 8 | 17 | 25 | 36 | 42 | Lower trunk of brachial plexus (C8, T1, Déjerine-Klumpke) |
9.13.2 Specific nerve lesions affecting the upper extremities
Only employees with an objectively verifiable diagnosis qualify for a WPI rating under Table 9.13.2a and Table 9.13.2b (both on following page). The diagnosis is made not only on credible and clinically logical symptoms but, more importantly, on the presence of positive clinical findings and loss of function. The diagnosis should be documented by electromyography as well as sensory and motor nerve conduction studies. As noted under the principles of assessment, the assessing medical practitioner should not order additional investigations solely for assessment purposes.
It is critical to understand that there is no correlation between the severity of conduction delay on nerve conduction velocity testing, and the severity of either symptoms or the WPI rating.
If available, surgical findings of evidence of nerve compression and reactive hyperaemia upon nerve release can be used to confirm the diagnosis.
Using the combined values chart (see Appendix 1), WPI ratings obtained for sensory impairment should be combined with WPI ratings for motor impairment.
A WPI rating under Tables 9.13.2a and 9.13.2b may be combined (except where the same nerve is assessed) with WPI ratings from Table 9.15: Cervical spine.
Table 9.13.2a: Specific nerve lesions affecting the upper extremities—sensory impairment
| Grading |
| 5 | 4 | 3 | 2 | 1 | 0 |
Nerve | % WPI |
Axillary | 0 | 1 | 1 | 2 | 3 | 3 |
Medial antebrachial cutaneous | 0 | 1 | 1 | 2 | 3 | 3 |
Medial brachial cutaneous | 0 | 1 | 1 | 2 | 3 | 3 |
Median nerve (above mid forearm) | 0 | 5 | 9 | 16 | 21 | 23 |
Median nerve (below mid forearm) | 0 | 5 | 9 | 16 | 21 | 23 |
Radial palmar digital of thumb | 0 | 1 | 2 | 3 | 4 | 4 |
Ulnar palmar digital of thumb | 0 | 1 | 3 | 5 | 6 | 7 |
Radial palmar digital of index finger | 0 | 1 | 1 | 2 | 3 | 3 |
Ulnar palmar digital of index finger | 0 | 0 | 1 | 1 | 2 | 2 |
Radial palmar digital of middle finger | 0 | 1 | 1 | 2 | 3 | 3 |
Ulnar palmar digital of middle finger | 0 | 0 | 1 | 1 | 2 | 2 |
Radial palmar digital of ring finger | 0 | 0 | 1 | 1 | 2 | 2 |
Musculocutaneous | 0 | 1 | 1 | 2 | 3 | 3 |
Radial (including loss of triceps function) | 0 | 1 | 1 | 2 | 3 | 3 |
Radial (at elbow with sparing of triceps) | 0 | 1 | 1 | 2 | 3 | 3 |
Suprascapular | 0 | 1 | 1 | 2 | 3 | 3 |
Ulnar (above mid forearm) | 0 | 1 | 2 | 3 | 4 | 4 |
Ulnar (below mid forearm) | 0 | 1 | 2 | 3 | 4 | 4 |
Ulnar palmar digital of ring finger | 0 | 0 | 0 | 1 | 1 | 1 |
Radial palmar digital of little finger | 0 | 0 | 0 | 1 | 1 | 1 |
Ulnar palmar digital of little finger | 0 | 0 | 1 | 1 | 2 | 2 |
Table 9.13.2b: Specific nerve lesions affecting the upper extremities—motor impairment
| Grading |
| 5 | 4 | 3 | 2 | 1 | 0 |
Nerve | % WPI |
Medial and lateral pectoral | 0 | 1 | 1 | 2 | 3 | 3 |
Axillary | 0 | 4 | 8 | 13 | 18 | 21 |
Dorsal scapular | 0 | 1 | 1 | 2 | 3 | 3 |
Long thoracic | 0 | 2 | 4 | 5 | 8 | 9 |
Median nerve (above mid forearm) | 0 | 5 | 10 | 16 | 22 | 26 |
Median nerve (anterior interosseous branch) | 0 | 2 | 4 | 5 | 8 | 9 |
Median nerve (below mid forearm) | 0 | 1 | 2 | 4 | 5 | 6 |
Musculocutaneous | 0 | 3 | 6 | 9 | 13 | 15 |
Radial (including loss of triceps function) | 0 | 5 | 10 | 15 | 21 | 25 |
Radial (at elbow with sparing of triceps) | 0 | 4 | 8 | 13 | 18 | 21 |
Subscapulars (upper and lower) | 0 | 1 | 1 | 2 | 3 | 3 |
Suprascapular (upper and lower) | 0 | 2 | 4 | 6 | 9 | 10 |
Thoracodorsal | 0 | 1 | 2 | 4 | 5 | 6 |
Ulnar (above mid forearm) | 0 | 6 | 11 | 17 | 24 | 28 |
Ulnar (below mid forearm) | 0 | 4 | 8 | 13 | 18 | 21 |
9.13.3 Complex regional pain syndromes
Complex regional pain syndromes (CRPS) include reflex sympathetic dystrophy (CRPS I), and causalgia (CRPS II). The hallmark of these syndromes is a characteristic burning pain that is present without stimulation or movement, that occurs beyond the territory of a single peripheral nerve, and that is disproportionate to the inciting event. The pain is associated with specific clinical findings, including signs of vasomotor and sudomotor dysfunction and, later, trophic changes of all tissues from skin to bone.
Sympathetic nervous system dysfunction was thought to be involved in the generation of the symptoms and signs; hence, the term reflex sympathetic dystrophy (RSD). Causalgia was considered similar to RSD except, unlike RSD, it followed a lesion of a peripheral nerve, either of a major mixed nerve in the proximal extremity (major causalgia) or of a purely sensory branch more distally (minor causalgia). A recent reconsideration of these syndromes has generated new terminology and ideas concerning the underlying pathophysiology. The International Association for the Study of Pain has proposed the term complex regional pain syndromes, which has replaced the term RSD with CRPS I and causalgia with CRPS II. The most important difference from earlier opinions is that sympathetic dysfunction is not assumed to be the underlying basis for the symptoms and signs of CRPS. It is felt that sympathetically maintained pain is not an essential component of CRPS, as it may be present in a variety of painful conditions, including or independent of CRPS.
Contrary to previous suggestions, regional sympathetic blockade has no role in the diagnosis of CRPS.
Since a subjective complaint of pain is the hallmark of these conditions, and many of the associated physical signs and radiographic findings can be the result of disuse, the differential diagnosis is extensive; it includes somatoform pain disorder, somatoform conversion disorder, factitious disorder, and malingering. Consequently, the approach to the diagnosis of these syndromes should be conservative and based on objective findings.
The criteria listed in Figure 9-E predicate a diagnosis of CRPS upon a preponderance of objective findings that can be identified during a standard physical examination and demonstrated by radiographic techniques. At least eight of these findings must be present concurrently for a diagnosis of CRPS. Signs are objective evidence of disease perceptible to the examiner, as opposed to symptoms, which are subjective sensations of the individual.
Use the methodology on page 154 to determine impairment. Use either steps in CRPS I (RSD) impairment determination or steps in CRPS II (causalgia) impairment determination as appropriate. Only one of the methodologies may be used and the impairment rating from one of the two methodologies may not be combined with a rating from the other methodology.
The impairment rating method described for sensory deficits due to lesions of digital nerves is not applied in CRPS.
Figure 9-E: Objective diagnostic criteria for CRPS (RSD and causalgia)
Local clinical signs |
Vasomotor changes: |
- Skin colour: mottled or cyanotic
|
|
|
Sudomotor changes: |
|
Trophic changes: |
- Skin texture: smooth, nonelastic
|
- Soft tissue atrophy: especially in fingertips
|
- Joint stiffness and decreased passive motion
|
- Nail changes: blemished, curved, talonlike
|
- Hair growth changes: fall out, longer, finer
|
Radiographic signs |
- Radiographs: trophic bone changes, osteoporosis
|
- Bone scan: findings consistent with CRPS
|
Interpretation |
≥ 8 Probable CRPS |
< 8 No CRPS |
Notes to Figure 9-E
- Modified and adapted from Ensalada LH, ‘Complex regional pain syndrome’, in Brigham CR, ed, The Guides Casebook, Chicago, Ill: American Medical Association, 1999, 14.
Figure 9-F: Impairment grading for CRPS
CRPS I & II | Sensory deficits and pain |
Grade (see Fig 9-D) | % of whole person impairment |
5 | 0 |
4 | 1-15 |
3 | 16-36 |
2 | 37-48 |
1 | 49-59 |
0 | 60 |
Steps in CRPS I (RSD) impairment determination
In CRPS I, neither the initiating causative factor nor the symptoms involve a specific peripheral nerve structure or territory. If the diagnostic test in Figure 9-E is satisfied, the impairment assessment is derived as follows.
Step 1 | Assess the WPI for the affected upper extremity resulting from loss of motion of each affected joint using Tables 9.8 to 9.11 as appropriate. |
Step 2 | Assess the appropriate percentage impairment of the affected extremity resulting from sensory deficits and pain according to the grade that best describes the severity of interference with activities as described in Figure 9-D (page 104). Use clinical judgment to select the appropriate severity grade from Figure 9-D and the appropriate percentage from within the range for each grade shown in Figure 9-F and explain the reasons for that selection. The maximum value is not automatically applied. |
Step 3 | Combine the impairment rating for sensory deficits and pain obtained from Step 2 with the rating obtained from Step 1. |
In contrast to CRPS II, impairment values for sensory and motor deficits of a specific nerve structure cannot be applied.
Steps in CRPS II (causalgia) impairment determination
In CRPS II, a specific sensory or mixed nerve structure is involved. If the diagnostic test in Figure 9-E is satisfied, the impairment assessment is derived as follows.
Step 1 | Assess the WPI for the affected upper extremity resulting from the loss of motion of each affected joint using Tables 9.8 to 9.11 as appropriate. |
Step 2 | Assess the appropriate percentage impairment of the affected extremity resulting from sensory deficits and pain of the injured nerve(s) according to the grade that best describes the severity of interference with activities as described in Figure 9-D. Use clinical judgment to select the appropriate severity grade from Figure 9-D and determine the WPI % for the relevant nerve(s) from Table 9.13.2a.. The maximum value is not automatically applied. |
Step 3 | Assess the appropriate percentage impairment of the affected extremity resulting from motor deficits and loss of power of the injured nerve(s) according to the grade that best describes the severity of interference with as described in Figure 9-D. Use clinical judgment to select the appropriate severity grade from Figure 9-D determine the WPI% for the relevant nerve(s) from Table 9.13.2b. The maximum value is not automatically applied. |
Step 4 | Combine the impairment ratings for sensory deficits and pain (Step 2), and for motor deficits and loss of power (Step 3), with the rating obtained from Step 1. The maximum WPI for the affected extremity is 60%. |
9.14 Upper extremity function
Before using Table 9.14 the medical assessor should read the instructions (see Part II—Introduction, see page 126) preceding the specific joint impairment tables (Tables 9.8–9.11). Table 9.14 is used strictly in accordance with those instructions. In particular, Table 9.14 cannot be used where an assessment can be made under one or more Table 9.9, 9.10 or 9.11 and there is no radiologically demonstrated joint instability or arthritis or arthroplasty.
Table 9.14 is an alternative table, which may be used instead of the specific orthopaedic or neurological table or tables. It is important to note that Table 9.14 assesses the function of the entire upper extremity. Consequently, for the purposes of ascertaining the most beneficial WPI rating for the same upper extremity, any assessment under Table 9.14 for a single upper extremity may be compared only with the total or combined impairment obtained after using other tables in Chapter 9, Part II—The upper extremities.
For the purposes of ascertaining the most beneficial WPI rating, Table 9.14 may not be compared with single impairments under the other tables, unless there are no other impairments affecting the upper extremities.
At least one major criterion, and at least two minor criteria (where listed), must be satisfied for a WPI rating to be assigned under Table 9.14. Where possible, the major criteria should be assessed on the basis of neurological examination of motor strength, co-ordination and dexterity. Where possible, functional activities should be assessed by observation of the specified activities.
Table 9.14 should be used only to assess impairment from objectively identified orthopaedic or neurological conditions arising in, and affecting, the upper extremities.
While it is true that disuse secondary to pain may produce secondary dysfunction of the upper extremities, this must not be assessed using Table 9.14 unless this dysfunction is permanent (that is, not likely to improve as a result of surgery, medication or other rehabilitative treatment) and there are objective clinical findings that cannot be validly assessed using other tables in Chapter 9, Part II—The upper extremities.
Table 9.14 must not be used for assessment of amputations.
Where one limb only is affected, regardless of the number of impairments found in that limb, the limb should be assessed using the relevant tables other than 9.14 and all impairments combined using the combined values table (see Appendix 1). The combined impairment rating should then be compared with the rating taken from the relevant (non-dominant or dominant) column in 9.14 and the higher rating obtained from the two methods used to determine WPI.
Where both limbs are affected, each limb should be assessed using the tables other than 9.14 and all impairments in both limbs combined using the combined values table. The combined impairment rating should then be compared with the rating taken from the ‘both extremities’ column in Table 9.14 and the higher rating obtained from the two methods used to determine WPI
Table 9.14 may be used to assess upper extremity impairment arising as a result of spinal cord damage. Use the special procedure set out in the introduction to Part III of this chapter. Table 9.14 is not to be used to assess upper extremity impairment arising as a result of nerve root compression, or other neurological sequelae of cervical spinal conditions. These should be assessed under Table 9.13.1, Table 9.13.2a and Table 9.13.2b (tables dealing with neurological impairments affecting the upper extremities, see pages 148-151).
Table 9.14 Upper extremity function
% WPI | % WPI | % WPI | Major criteria (at least one required) | Minor criteria (at least two required where listed) |
Non-dominant extremity | Dominant extremity | Both extremities |
0 | 0 | 0 | Normal digital dexterity. No limitations in use of extremity for personal care. | Writes 2 A4 pages or more at one time. Can lift more than 13 kilograms (males). Can lift more than 9 kilograms (females). Able to lace shoes easily. Joins paper clips without difficulty. |
3 | 5 | 10 | Minor loss of digital dexterity. Minor limitations in use of extremity for personal care. | Rests after writing an A4 page. Cannot lift more than 13 kilograms (males). Cannot lift more than 9 kilograms (females). Finds it difficult to do up shoelaces. Fumbles when joining paper clips. |
10 | 10 | 20 | Moderate loss of digital dexterity. Moderate limitations in use of extremity for personal care. | Rests after writing half an A4 page. Cannot lift more than 4.5 kilograms. Cannot do up shoelaces. Cannot join paperclips. Dresses slowly unassisted. |
15 | 20 | 35 | Major loss of digital dexterity. Major restrictions in personal care. | Rests after writing 50 words or less. Cannot lift more than 1.5 kilograms. Cannot put on a tie or belt. Needs assistance to cut up food. Needs some assistance to dress. |
Table 9.14 continued on following page.
Table 9.14 (continued)
% WPI | % WPI | % WPI | Major criteria (at least one required) | Minor criteria (at least two required where listed) |
Non-dominant extremity | Dominant extremity | Both extremities | | |
25 | 30 | 50 | Little useful digital co-ordination. Severely limited use of extremity for personal care. | Rests after writing 10 words or less. Cannot lift more than 0.5 kilograms. Constantly drops light objects (eg, cups). Unable to cut up food. Needs extensive assistance to dress. |
30 | 40 | 60 | No co-ordination of digits. Severely limited use of extremity for personal care. | Unable to sign name. Constantly needs a splint to write or eat. Unable to lift light objects. Needs food placed in mouth to eat. Unable to dress without assistance. |
40 | 50 | 70 | Minimal extremity movement against gravity. Cannot use extremity for personal care. | Cannot use extremity to eat. Cannot bring a pen to paper. Cannot raise extremity to assist dressing. |
60 | 60 | 84 | Unable to use upper extremity at all. | |
The medical examiner should:
- obtain a comprehensive, accurate medical history and review all relevant available records
- include in the assessment report a comprehensive description of current symptoms and their relationship to daily activities, detailed findings on physical examination, and all findings of relevant diagnostic and ancillary tests
- indicate how the impairment assessment was calculated by reference to the relevant tables.
For the same condition, WPI ratings from Table 9.7: Lower extremity function (see page 123) and/or Table 9.14: Upper extremity function (see page 158), are not normally combined with WPI ratings from Table 9.15: Cervical spine, Table 9.16: Thoracic spine, or Table 9.17: Lumbar spine.
However, the special procedure set out below applies where there is spinal cord injury with neurological sequelae (that is, corticospinal tract involvement).
Step 1 | Assess (where applicable): 1.1. Lower limb impairment using Table 9.7 1.2. Upper limb impairment using Table 9.14 1.3. Bladder/urological dysfunction using Table 12.7: Neurological impairment of the urinary system (see Chapter 12—The neurological system) 1.4. Anorectal dysfunction using Table 12.8: Neurological impairment of the anorectal system (see Chapter 12—The neurological system) 1.5. Sexual dysfunction using Table 12.9: Neurological impairment affecting sexual function (see Chapter 12—The neurological system) 1.6. Respiratory dysfunction (for example, with cervical spinal cord injuries) using Table 12.6: Neurological Impairment of the Respiratory System (see Chapter 12—The neurological system). |
Step 2 | Combine the relevant impairments from 1-6 in Step 1 above, as applicable. |
Step 3 | Then combine the WPI from the above procedure with the relevant WPI from Table 9.15, Table 9.16 or Table 9.17 (diagnosis-related estimates) to obtain the final WPI. |
For injuries not involving spinal cord damage but resulting in nerve root involvement/radiculopathy, use Table 9.15, Table 9.16 or Table 9.17, but do not combine with WPI ratings from Tables 9.7 or 9.14.
Except where the same nerve is involved, WPI ratings from Table 9.15, Table 9.16 and Table 9.17 (where relevant) may be combined with WPI ratings under the following tables:
- Table 9.6.1, Table 9.6.2a, Table 9.6.2b (tables dealing with spinal nerve root impairments and peripheral nerve injuries affecting the lower extremities)
- Table 9.13.1, Table 9.13.2a and Table 9.13.2b (tables dealing with neurological impairments affecting the upper extremities).
Where there is brachial plexus involvement, WPI ratings from Table 9.15: Cervical spine—diagnosis-related estimates may not be combined with WPI ratings under Table 9.13.1: Cervical nerve root impairment.
Definitions of clinical findings for diagnosis-related estimates in assessing spinal impairment (see below) are used when assessing impairments of the spine under Table 9.15, Table 9.16 and Table 9.17.
These definitions are taken from the American Medical Association’s Guides to the Evaluation of Permanent Impairment 5th edition 2001.
Alteration of motion segment integrity—motion segment alteration can be either loss of motion segment integrity (increased translational or angular motion), or decreased motion secondary to developmental fusion, fracture healing, healed infection, or surgical arthrodesis. An attempt at arthrodesis may not necessarily result in a solid fusion but may significantly limit motion at a motion segment. Motion of the individual spine segments cannot be determined by a physical examination but is evaluated with flexion and extension roentgenograms. When routine x-rays are normal and severe trauma is absent, motion segment alteration is rare, and flexion and extension roentgenograms are indicated only if motion segment alteration is suspected from the individual’s history or routine x-rays.
Asymmetry of spinal motion in one of the three principal planes is sometimes caused by muscle spasm or guarding. That is, if an individual attempts to flex the spine, he or she is unable to do so moving symmetrically: rather, the head or trunk leans to one side. To qualify as true asymmetric motion, the finding must be reproducible and consistent, and the examiner must be convinced that the individual is co-operative and giving full effort.
Atrophy is measured with a tape measure at identical levels on both limbs. For reasons of reproducibility, the difference in circumference should be 2cm or greater in the thigh, and 1cm or greater in the arm, forearm, or leg.
Cauda equina syndrome is manifested by bowel or bladder dysfunction, saddle anaesthesia and variable loss of motor and sensory function in the lower extremities. Individuals with cauda equina syndrome usually have loss of sphincter tone on rectal examination and diminished or absent bladder, bowel, and lower limb reflexes.
Electrodiagnostic verification of radiculopathy—unequivocal electrodiagnostic evidence of acute nerve root pathology includes the presence of multiple positive sharp waves or fibrillation potentials in muscles innervated by one nerve root. However, the quality of the person performing and interpreting the study is critical. Electromyography should be performed only by a physician qualified through education, training, and experience in these procedures. Electromyography does not detect all compressive radiculopathies and cannot determine the cause of the nerve root pathology. On the other hand, electromyography can detect non-compressive radiculopathies which are not identified by imaging studies.
Loss of motion segment integrity is defined as an anteroposterior motion of one vertebra over another that is greater than 3.5mm in the cervical spine, greater than 2.5mm in the thoracic spine, and greater than 4.5mm in the lumbar spine. Alternatively, it is defined as a difference in the angular motion of two adjacent motion segments greater than 15 at L1-2, L2-3 and L3-4, greater than 20 at L4-5 and greater than 25 at L5-S1. In the cervical spine, it is also defined as motion at one level that is more than 11 greater than at either adjacent level.
Muscle guarding is a contraction of muscle to minimise motion or agitation of the injured or diseased tissue. It is not true muscle spasm because the contraction can be relaxed. In the lumbar spine, the contraction frequently results in loss of the normal lumbar lordosis, and it may be associated with reproducible loss of spinal motion.
Muscle spasm is a sudden, involuntary contraction of a muscle or group of muscles. Paravertebral muscle spasm is common after acute spinal injury but is rare in chronic back pain. It is occasionally visible as a contracted paraspinal muscle but is more often diagnosed by palpation (a hard muscle).
To differentiate true muscle spasm from voluntary muscle contraction, the individual should not be able to relax the contractions. The spasm should be present standing, as well as in the supine position, and frequently causes a scoliosis. The physician can sometimes differentiate spasm from voluntary contraction by asking the individual to place all his or her weight first on one foot, and then the other, while the physician gently palpates the paraspinous muscles. With this manoeuvre, the individual normally relaxes the paraspinal muscles on the weight-bearing side. If the examiner witnesses this relaxation, it usually means that true muscle spasm is not present.
Non-verifiable radicular root pain is pain that is in the distribution of a nerve root but has no identifiable origin (that is, there are no objective physical, imaging, or electromyographic abnormal findings).
Radiculopathy is significant alteration in the function of a nerve root or nerve roots, and is usually caused by pressure on one or several nerve roots. The diagnosis requires a dermatomal distribution of pain, numbness, and/or paraesthesia. A root tension sign is usually positive. A diagnosis of herniated disc must be substantiated by an appropriate finding on an imaging study. The presence of findings on an imaging study is insufficient to make the diagnosis of radiculopathy. There must also be clinical evidence as described above.
Reflexes may be normal, increased, reduced, or absent. For reflex abnormalities to be considered valid, the involved and normal limb(s) should show marked asymmetry between arms or legs on repeated testing. Once lost because of previous radiculopathy, a reflex rarely returns. Abnormal reflexes such as Babinski signs or clonus may be signs of corticospinal tract involvement.
Urodynamic tests—cystometrograms are useful in individuals where a cauda equina syndrome is possible but not certain. A normal cystometrogram makes the presence of a nerve-related bladder dysfunction unlikely. Occasionally, more extensive urodynamic testing is necessary.
Weakness and loss of sensation—to be valid, the sensory findings must be in a strict anatomical distribution (that is, follow dermatomal patterns). Motor findings should also be consistent with the affected nerve structure(s). Significant, long-standing weakness is usually accompanied by atrophy.
For multiple fractures involving the spinal canal on more than one level, as distinct from the spinous processes or facet joints, the assessment made under Tables 9.15, 9.16 or 9.17 is to be adjusted as follows:
- where there are multi-level fractures but no associated neurological compromise:
- increase the assessment under Tables 9.15, 9.16 or 9.17 by one level
- where there are multi-level fractures with neurological compromise:
- increase the assessment under Tables 9.15, 9.16 or 9.17 by two levels.
The adjustment, by one or two levels, as applicable, may be made only once under each table.
The adjusted WPI assessment may not exceed the maximum WPI rating available in each individual table.
Table 9.15: Cervical spine—diagnosis-related estimates
% WPI | Criteria |
0 | No significant clinical findings, no muscular guarding, no documented neurological impairment, no significant loss of motion segment integrity, no other indication of impairment related to injury or illness or No fractures. |
8 | Clinical history and examination findings compatible with specific injury. Findings may include: muscle guarding or spasm; asymmetric loss of range of motion or nonverifiable radicular complaints defined as complaints of radicular pain without objective findings. No alteration of structural integrity or Clinically significant radiculopathy and radiologically demonstrated disc herniation consistent with the radiculopathy (improved following non-operative treatment) or Fractures: - Compression fracture of one vertebral body of less than 25%
- Posterior element fracture without dislocation—healed without loss of structural integrity or radiculopathy
- Spinous or transverse process fracture with displacement.
|
Table 9.15 continued on following page.
% WPI | Criteria |
10 - 18 | Significant signs of radiculopathy, such as pain and/or sensory loss in a dermatomal distribution, loss or alteration of relevant reflex(es), loss of muscle strength, or unilateral atrophy compared with the unaffected side, measured at the same distance above or below the elbow: the neurological impairment may be verified by electrodiagnostic findings or Clinically significant radiculopathy and radiologically verified disc herniation consistent with the radiculopathy, or with improved radiculopathy following surgery or Fractures: - Compression fracture of one vertebral body of 25% to 50%—healed without loss of structural integrity, with or without radiculopathy
- Posterior element fracture with displacement disrupting the spinal canal—healed without loss of structural integrity, with or without radiculopathy.
Note: In the case of fractures, differentiation from a congenital or developmental condition should be accomplished, if possible, by examining pre-injury roentgenograms, if available, or by a bone scan performed after the onset of the condition. |
28 | Alteration of motion segment integrity (at least 3.5mm of translation of one vertebra on another or angular motion of more than 11º greater than at each adjacent level) or Bilateral or multilevel radiculopathy with radiologically verified disc herniation consistent with the radiculopathy or Loss of motion of a motion segment due to a developmental fusion or successful or unsuccessful attempt at surgical arthrodesis or Compression fracture of one vertebral body of more than 50% without residual neural compromise. |
38 | Significant upper extremity impairment requiring the use of upper extremity external functional or adaptive device(s); There may be total neurological loss at a single level or severe, multilevel neurological dysfunction or Structural compromise of the spinal canal with severe upper extremity motor and sensory deficits but without lower extremity involvement. |
Notes to Table 9.15
- Assessors should refer to the Principles of Assessment for guidance on awarding an impairment value within a range.
Table 9.16: Thoracic spine—diagnosis-related estimates
% WPI | Criteria |
0 | No significant clinical findings, no muscular guarding, no documented neurological impairment, no significant loss of motion segment integrity, no other indication of impairment related to injury or illness or No fractures. |
8 | History and examination findings compatible with a specific injury or illness. Findings may include: significant muscle guarding or spasm; asymmetric loss of range of motion (dysmetria); or non verifiable radicular complaints, defined as complaints of radicular pain without objective findings. No alteration of motion segment integrity or Herniated disc at the level and on the side that would be expected from objective clinical findings, but without radicular signs following conservative treatment or Fractures: - Compression fracture of one vertebral body of less than 25%
- Posterior element fracture without dislocation—healed without alteration of motion segment integrity or radiculopathy
- Spinous or transverse process fracture with displacement, but without a vertebral body fracture.
|
Table 9.16 continued on following page.
Table 9.16 (continued)
% WPI | Criteria |
10 - 18 | Ongoing neurological impairment of the lower extremity related to a thoracolumbar injury, documented by alteration of motor and sensory functions, altered reflexes, or findings of unilateral atrophy above or below the knee related to no other condition, or verified by electrodiagnostic testing or Clinically significant radiculopathy and radiologically verified disc herniation consistent with the radiculopathy, or with improved radiculopathy following surgery or Fractures: - Compression fracture of one vertebral body of 25% to 50%—healed without alteration of structural integrity
- Posterior element fracture with mild displacement disrupting the canal—healed without alteration of structural integrity.
Note: Differentiation from a congenital or developmental condition should be accomplished, if possible, by examining pre-injury roentgenograms, if available, or by a bone scan performed after the onset of the condition. |
23 | Alteration of motion segment integrity (at least 2.5mm translation of one vertebra on another) or Bilateral or multilevel radiculopathy with radiologically verified disc herniation consistent with the radiculopathy or Compression fracture of one vertebral body of more than 50% without residual neural compromise |
28 | Significant signs of radiculopathy, such as dermatomal pain and/or in a dermatomal distribution, sensory loss, loss of relevant reflex(es), loss of muscle strength or measured unilateral atrophy above or below the knee compared to measurements on the contralateral side at the same location (may be verified by electrodiagnostic findings) and Alteration of motion segment integrity (at least 2.5mm translation of one vertebra on another) or Compression fracture of one vertebral body by more than 50% with neural motor compromise, but not bilateral involvement. In that instance, refer notes concerning corticospinal tract impairment evaluation (see page 114, Part III—Introduction). |
Notes to Table 9.16
- Assessors should refer to the Principles of Assessment for guidance on awarding an impairment value within a range.
Table 9.17: Lumbar spine—diagnosis-related estimates
% WPI | Criteria |
0 | No significant clinical findings, no observed muscle guarding or spasm, no documented neurological impairment, no documented alteration in structural integrity, and no other indication of impairment related to injury or illness or No fractures. |
8 | Clinical history and examination findings compatible with a specific injury. Findings may include: significant muscle guarding or spasm; asymmetric loss of range of motion; or nonverifiable radicular complaints, defined as complaints of radicular pain without objective findings. No alteration of the structural integrity and no significant radiculopathy or Prior clinically significant radiculopathy and radiologically demonstrated disc herniation, consistent with the radiculopathy, but radiculopathy no longer present following conservative treatment or Fractures: - Compression fracture of one vertebral body of less than 25%
- Posterior element fracture without dislocation (not developmental spondylolysis) that has healed without alteration of motion segment integrity
- Spinous or transverse process fracture with displacement without a vertebral body fracture, with no disruption of the spinal canal.
|
Table 9.17 continued on following page.
Table 9.17 (continued)
% WPI | Criteria |
10 - 13 | Significant signs of radiculopathy, such as dermatomal pain and/or in a dermatomal distribution, sensory loss, alteration of relevant reflex(es), loss of muscle strength or measured unilateral atrophy above or below the knee compared to measurements on the contralateral side at the same location (may be verified by electrodiagnostic findings) or History of a herniated disc at the level and on the side consistent with objective clinical findings, associated with radiculopathy, or employees who have had surgery for radiculopathy but are now asymptomatic or Fractures: - Compression fracture of one vertebral body of 25% to 50%—healed without alteration of structural integrity
- Posterior element fracture with displacement disrupting the spinal canal —healed without alteration of structural integrity.
|
23 | Loss of motion segment integrity (at least 4.5mm of translation of one vertebra on another, or angular motion greater than 15º at L1-2, L2-3, and L3-4, greater than 20º at L4-5, and greater than 25º at L5-S1). May have complete, or near complete, loss of motion of a motion segment due to developmental fusion, or successful or unsuccessful attempt at surgical arthrodesis or Compression fracture of one vertebral body of more than 50%, without residual neurological compromise. |
28 | Both radiculopathy and loss of motion segment integrity are present, with significant lower extremity impairment indicated by atrophy or loss of reflex(es), pain, and/or sensory changes within an anatomic distribution (dermatomal), verified by electrodiagnostic findings and at least 4.5mm of translation of one vertebra on another or angular motion greater than 15º at L1-2, L2-3, and L3-4, greater than 20º at L4-5, and greater than 25º at L5-S1 or Compression fracture of one vertebral body of more than 50%, with unilateral neurological compromise. |
- Assessors should refer to the Principles of Assessment for guidance on awarding an impairment value within a range.
A WPI rating from Table 9.18 may be combined with WPI ratings from Table 9.15: Cervical spine, Table 9.16: Thoracic spine, and Table 9.17: Lumbar spine.
Table 9.18: Fractures of the pelvis
% WPI | Criteria (one required— different conditions may be assessed separately) |
0 | Healed fracture: - without displacement or residual signs
- of one or both rami with displacement but without residual signs
- of ischium or ilium with displacement but without residual signs
- of coccyx with displacement but without residual signs
- of one pubic ramus with displacement, deformity and residual signs.
|
2 | Healed fracture of ilium with displacement, deformity and residual signs. |
5 | Healed fracture of: - sacrum with displacement but without residual signs
- symphysis pubis without separation and without residual signs
- both pubic rami with displacement, deformity and residual signs.
Non-union of coccyx fracture. Excision of coccyx. |
10 | Healed fracture of: - ischium with displacement of 2.5cm or more, deformity and residual signs
- sacrum involving sacro-iliac joint.
|
15 | Healed fracture of symphysis pubis with separation or displacement. |
Evaluate in accordance with Table 9.4 | Fracture involving acetabulum. |
10.0 Introduction
10.1 The upper urinary tract
10.2 Urinary diversion
10.3 Lower urinary tract
In conducting an assessment, the assessor must have regard to the Principles of Assessment (see pages 23-26) and the definitions contained in the Glossary (see pages 27-28).
Impairments assessed under Chapter 10 include those caused by secondary conditions accompanying an endocrine system condition. An impairment assessed under Chapter 3 – The Endocrine System (see page 51) should be combined with those resulting from the secondary conditions assessed under Chapter 10.
The upper urinary tract comprises the kidney and ureters.
Upper urinary tract dysfunction may be indicated by symptoms and signs including:
- changes in urination
- oedema
- decreased physical stamina
- appetite and weight loss
- anaemia
- uraemia
- loin, abdominal or costovertebral angle pain
- haematuria
- rigours / chills and fever
- hypertension or its complications
- abnormalities in the appearance of the urine or its sediment
- biochemical blood changes.
Especially in its early stages, renal disease may only become evident with laboratory findings.
Continuous medical treatment includes drug or dietary therapy.
Renal replacement therapy includes peritoneal or haemodialysis and renal transplantation.
Table 10.1: The upper urinary tract
| Criteria (criteria in both Category A and Category B must be satisfied if present) |
| Category A | Category B |
% WPI | Creatinine clearance | Other symptom(s) |
0 | >62 ml/min | And intermittent symptoms and signs of upper urinary tract dysfunction are present but do not require continuous treatment or surveillance. |
5 | 52-62 ml/min | And intermittent symptoms and signs of upper urinary tract dysfunction are present but do not require continuous treatment or surveillance. |
10 | not applicable | Loss of one kidney or one kidney not functioning. |
15 | >62 ml/min | And intermittent symptoms and signs of upper urinary tract dysfunction are present and require continuous surveillance and frequent treatment. |
20 | 52-62 ml/min | And symptoms and signs of upper urinary tract dysfunction are present and require continuous surveillance and frequent treatment. |
25 | not applicable | Successful renal transplantation results in marked renal function improvement (regardless of creatinine clearance level). |
30 | 43-52 ml/min | And symptoms and signs of upper urinary tract dysfunction are present and require continuous surveillance and frequent treatment. |
40 | 28-42 ml/min | Not applicable |
50 | 43-52 ml/min | AND symptoms and signs of upper urinary tract dysfunction are present and are not completely controlled by surgical or continuous medical treatment. |
60 | <28 ml/min | Not applicable |
70 | 28-42 ml/min | And symptoms and signs of upper urinary tract dysfunction are present and are not controlled by surgical or continuous treatment. |
80 | <28 ml/min | And symptoms and signs of upper urinary tract dysfunction are present and are not controlled by surgical or continuous treatment. |
90 | <14 ml/min | And renal replacement therapy. |
95 | <14 ml/min | And metabolic coma from renal failure. |
10.2 Urinary diversion
Using the combined values chart (see Appendix 1), WPI ratings derived from Table 10.2 below may be combined with WPI ratings derived from Table 10.1 (on previous page).
Table 10.2: Urinary diversion
% WPI | Type of diversion |
10 | Ureterointestinal. Cutaneous ureterostomy. |
15 | Nephrostomy. |
10.3 Lower urinary tract
The lower urinary tract comprises the bladder and urethra.
Table 10.3: Lower urinary tract is on the following page.
Using the combined values chart (see Appendix 1), WPI ratings derived from Table 10.3 may be combined with WPI ratings from Table 10.1—The upper urinary tract, and with WPI ratings from Table 10.2: Urinary diversion.
Impairment in the lower urinary tract due to neurological causes, as opposed to local lower urinary tract pathology, should be assessed under Table 12.7: Neurological impairment of the urinary system (see Chapter 12—The neurological system).
If:
- several impairments of the urinary system are present; and
- there is an impairment of bladder function due to neurological causes
then:
- a WPI rating from Table 10.3 (except for bladder function) may be combined with a WPI rating from Chapter 12—The neurological system.
Symptoms and signs of bladder disorder include:
- urinary frequency
- dysuria
- strangury
- urinary incontinence
- urine retention
- haematuria
- pyuria
- passage of urinary calculi
- a suprapubic mass.
Signs and symptoms of urethra function impairment include:
- dysuria
- diminished urinary stream
- urinary retention
- incontinence
- extraneous or ectopic urinary openings
- periurethral masses
- diminished urethral calibre.
Table 10.3: Lower urinary tract
% WPI | Criteria |
0 | Symptoms and signs of bladder or urethral disorder occurring 1-3 times a year and requiring intermittent treatment—between episodes lower urinary tract function is normal. |
5 | Symptoms and signs of bladder or urethral disorder occurring 4-6 times a year and requiring intermittent treatment—between episodes lower urinary tract function is normal or urethral stricture requiring dilation up to six times a year—between dilations there is normal urethral function. |
10 | Symptoms and signs of bladder disorder occurring 7-12 times a year and requiring intermittent treatment—between episodes bladder function is normal or urethral stricture requiring dilation more than six times a year—between dilations there are significant periods of normal urethral function. |
15 | Symptoms and signs of bladder disorder occurring more than 12 times a year and requiring intermittent treatment – between episodes bladder function is normal or urethral fistula. |
20 | Symptoms and signs of bladder disorder requiring continuous treatment or good bladder reflex activity (that is, storage of urine) but no voluntary control over the reflex activity or urethral stricture requiring dilation more than six times a year—between dilations there are no significant periods of normal urethral function. |
30 | Poor reflex bladder activity (that is, intermittent dribbling incontinence, stress incontinence or urge incontinence) and no voluntary control over the incontinence or urethral dysfunction resulting in intermittent urine dribbling and loss of voluntary urinary control. |
40 | No reflex or voluntary control of bladder (that is, continuous dribbling incontinence) or urinary diversion with cystectomy. |
.
11.0 Introduction
11.1 Male reproductive system
11.1.1 Male reproductive organs—penis
11.1.2 Male reproductive organs—scrotum
11.1.3 Male reproductive organs—testes, epididymes and spermatic cords
11.1.4 Male reproductive organs—prostate and seminal vesicles
11.2 Female reproductive system
11.2.1 Female reproductive organs—vulva and vagina
11.2.2 Female reproductive organs—cervix and uterus
11.2.3 Female reproductive organs—fallopian tubes and ovaries
In conducting an assessment, the assessor must have regard to the principles of assessment (see pages 23-26) and the definitions contained in the glossary (see pages 27-28).
WPI ratings from Tables 11.1.1, 11.1.2, 11.1.3, and 11.1.4 may be combined, provided the total WPI rating for all conditions affecting ability to father children does not exceed 20%.
The WPI ratings in Tables 11.1.1, 11.1.2, 11.1.3 and 11.1.4 are applicable to 40–65 year old men.
Where the employee is outside this age group, the following calculation should be made:
- for men 39 years of age or younger, the combined WPI rating (from Tables 11.1.1, 11.1.2, 11.1.3 and 11.1.4) is increased by 50%
- men 66 years of age or older, the combined WPI rating (from Tables 11.1.1, 11.1.2, 11.1.3 and 11.1.4) is decreased by 50%.
For example, a 29 year old man with a combined maximum WPI of 20% of the male reproductive system would be rated as suffering a 30% WPI: 20% WPI + (0.5 x 20%WPI) = 30% WPI.
Tables 11.1.1, 11.1.2, 11.1.3, and 11.1.4 are not to be used with respect to sexual dysfunction arising as a result of neurological impairments rather than local reproductive pathology. Where sexual dysfunction is the result of spinal cord injury, use Table 9.6.1: Spinal nerve root impairment affecting the lower extremity (see page 85, Chapter 9—The musculoskeletal system). Where sexual dysfunction is the result of neurological disorder other than spinal nerve root impairment, use Table 12.9: Neurological impairment affecting sexual function (see page 152, Chapter 12—The neurological system).
Tables 11.1.1, 11.1.2, 11.1.3, and 11.1.4 are intended for use only to assess impairment resulting from neurological impairment, or local lesions of:
- penis
- scrotum
- testes
- epididymes
- spermatic cords
- prostate and/or seminal vesicles.
These tables can be used to assess impairment where obstruction of the vascular supply of the penis and other male organs occurs.
These tables are not intended for use where sexual function is impaired for any other reason (for example, pain or depression).
Table 11.1.1: Male reproductive organs—penis
% WPI | Criteria |
0 | Occasional interference with sexual function. |
10 | Sexual function possible but always with a degree of difficulty with erection, ejaculation and/or sensation. |
15 | Sexual function possible in that there is sufficient erection but sensation and/or ejaculation is absent. |
20 | No sexual function is possible. |
Skin disorders such as dermatitis, or tinea, affecting the scrotal skin are assessed under Table 4.1: Skin disorders (see Chapter 4—Disfigurement and skin disorders). Table 11.1.2 is not used to assess these conditions.
Table 11.1.2: Male reproductive organs—scrotum
% WPI | Criteria |
0 | Symptoms and/or signs of scrotal loss or disease with no evidence of testicular malfunction, malposition or loss of mobility. |
5 | Symptoms and/or signs of scrotal loss or disease with no evidence of testicular malfunction but with testicular malposition or loss of mobility. |
10 | Total loss of scrotum or symptoms and signs of scrotal loss or disease with necessity for testes to be implanted elsewhere to preserve testicular function. |
15 | Symptoms and signs of scrotal loss or disease with necessity for testes to be implanted elsewhere to preserve testicular function and scrotal pain or discomfort present with physical activity. |
20 | Symptoms and signs of scrotal loss or disease unable to be controlled by treatment and scrotal pain severely limits physical activity. |
Table 11.1.3: Male reproductive organs—testes, epididymes and spermatic cords
% WPI | Criteria |
0 | Symptoms and signs of testicular, epididymal and/or spermatic cord dysfunction are present and there is anatomical alteration and continuous treatment is not required and there are no seminal or hormonal abnormalities. |
5 | Loss of one testis |
10 | Symptoms and signs of testicular, epididymal and/or spermatic cord dysfunction are present and there is anatomical alteration and continuous or frequent treatment is required, or treatment is not possible and there are no seminal or hormonal abnormalities. |
15 | Symptoms and signs of testicular, epididymal and/or spermatic cord dysfunction are present and there is anatomical alteration and continuous or frequent treatment is required, or treatment is not possible and there is no detectable seminal or hormonal function. |
20 | Loss of both testes. |
Table 11.1.4: Male reproductive organs—prostate and seminal vesicles
% WPI | Criteria |
0 | Symptoms and signs of prostate and/or seminal vesicle disease or dysfunction are present and there is anatomical alteration and continuous or very frequent treatment not required. |
10 | Frequent and severe symptoms of prostate and/or seminal vesicle disease or dysfunction are present and there is anatomical alteration and continuous or very frequent treatment not required. |
15 | Prostatectomy. |
WPI ratings from Tables 11.2.1, 11.2.2 and 11.2.3 (see this and following pages) may be combined. However, the total WPI rating for all conditions affecting ability to conceive and be delivered of children may not exceed 30%.
Tables 11.2.1, 11.2.2, and 11.2.3 are not to be used with respect to sexual dysfunction arising as a result of neurological impairments rather than local reproductive pathology. Where sexual dysfunction is the result of spinal cord injury, use Table 9.6.1: Spinal nerve root impairment affecting the lower extremity (see Chapter 9—The musculoskeletal system). Where sexual dysfunction is the result of neurological disorder other than spinal nerve root impairment, use Table 12.9: Neurological impairment affecting sexual function (see Chapter 12—The neurological system).
Table 11.2.1: Female reproductive organs—vulva and vagina
% WPI | Criteria—pre-menopausal | Criteria—post-menopausal |
0 | Symptoms and signs of disease or deformity of the vulva and/or vagina are present and continuous treatment is not required and sexual intercourse is possible and the vagina is adequate for childbirth. | Symptoms and signs of disease or deformity of the vulva and/or vagina are present and continuous treatment is not required and sexual intercourse is possible with or without considerable difficulty. |
10 - 15 | Symptoms and signs of disease or deformity of the vulva and/or vagina are present and continuous treatment is required and sexual intercourse is possible only with difficulty and limited potential for vaginal delivery. | Symptoms and signs of disease or deformity of the vulva and/or vagina are present and continuous treatment is required and may not control symptoms and sexual intercourse is not possible. |
25 | Symptoms and signs of disease or deformity of the vulva and/or vagina are present and continuous treatment does not control symptoms and sexual intercourse is not possible and vaginal delivery is not possible. | |
Notes to Table 11.2.1
- Assessors should refer to the Principles of Assessment for guidance on awarding an impairment value within a range.
Table 11.2.2: Female reproductive organs—cervix and uterus
See notes to Table 11.2.2 immediately following the table.
% WPI | Criteria —pre-menopausal | Criteria—post-menopausal |
0 | Symptoms or signs of disease or deformity of cervix and/or uterus present and continuous treatment not required or cervical stenosis not requiring treatment. | Cervical stenosis. Anatomical loss of cervix and/or uterus. |
5 | | Symptoms and signs of disease or deformity of cervix and/or uterus present and continuous treatment required. |
10 | Symptoms and signs of disease or deformity of cervix and/or uterus present and continuous treatment required. | Symptoms and signs of disease or deformity of the cervix and/or uterus present and treatment does not give control. |
15 | Cervical stenosis requiring periodic treatment. | |
25 | Symptoms and signs of disease or deformity of cervix and/or uterus present and treatment does not control symptoms or complete cervical stenosis. | |
30 | Total hysterectomy and/or amputation of cervix. | |
Notes to Table 11.2.2
1. Hormone replacement therapy is not considered continuous treatment for the purposes of Table 11.2.2.
2. Oral contraception may be considered continuous treatment if pregnancy is contraindicated because of the cervical or uterine lesion.
Table 11.2.3: Female reproductive organs—fallopian tubes and ovaries
% WPI | Criteria—pre-menopausal | Criteria—post-menopausal |
0 | Symptoms or signs of disease or deformity of the fallopian tubes or ovaries present and continuous treatment not required and no difficulties with conception or loss of one ovary. | Symptoms or signs of disease or deformity of the fallopian tubes or ovaries present and continuous treatment not required or unilateral or bilateral loss of one or both fallopian tubes and/or one or both ovaries. |
5 | Symptoms or signs of disease or deformity of the fallopian tubes or ovaries present and continuous treatment not required and conception possible with medical intervention or loss of one fallopian tube. | Symptoms or signs of disease or deformity of the fallopian tubes or ovaries present and continuous treatment required. |
10 | Symptoms or signs of disease or deformity of the fallopian tubes or ovaries present and continuous treatment required and conception is possible although medical intervention may be required. | Symptoms or signs of disease or deformity of the fallopian tubes or ovaries present and continuous treatment does not give control. |
20 | Bilateral loss of both fallopian tubes or irreparable loss of patency of both fallopian tubes. | |
30 | Loss of both ovaries or failure to produce ova despite treatment. | |
12.0 Introduction
12.1 Disturbances of levels of consciousness and awareness
12.1.1 Permanent disturbances of levels of consciousness and awareness
12.1.2 Epilepsy, seizures and convulsive disorders
12.1.3 Sleep and arousal disorders
12.2 Impairment of memory, learning, abstract reasoning and problem solving ability
12.3 Communication impairments—dysphasia and aphasia
12.4 Emotional or behavioural impairments
12.5 Cranial nerves
12.5.1 The olfactory nerve (I)
12.5.2 The optic nerve, the oculomotor and trochlear nerves and the abducens (II, III, IV and VI)
12.5.3 The trigeminal nerve (V)
12.5.4 The facial nerve (VII)
12.5.5 The auditory nerve (VIII)
12.5.6 The glossopharyngeal, vagus, spinal accessory and hypoglossal nerves (IX, X, XI,and XII)
12.6 Neurological impairment of the respiratory system
12.7 Neurological impairment of the urinary system
12.8 Neurological impairment of the anorectal system
12.9 Neurological impairment affecting sexual function
In conducting an assessment, the assessor must have regard to the principles of assessment (see pages 23-26) and the definitions contained in the glossary (see pages 27-28).
The four categories of cerebral impairment are:
- disturbances of levels of consciousness or awareness (see Table 12.1.1, Table 12.1.2 and Table 12.1.3)
- impairment of memory, learning, abstract reasoning and problem solving ability (see Table 12.2)
- communication impairments (see Table 12.3.1 and Table 12.3.2)
- emotional or behavioural impairments (see Table 12.4).
WPI ratings from these four categories of cerebral impairment may not be combined with each other. The highest WPI rating from these four categories is to be used. Unless otherwise indicated, the highest WPI rating may then be combined with:
- a WPI rating from any other table or tables in Chapter 12 other than tables covering the first four categories
- WPI ratings from tables in other chapters.
The following procedure should be used in assessing cerebral function.
Step 1 | Determine whether disturbance is present in the level of consciousness or awareness (Table 12.1.1, Table 12.1.2 and Table 12.1.3). This may be a permanent alteration or an intermittent alteration in consciousness, awareness or arousal. Use the most applicable of Table 12.1.1, Table 12.1.2 or Table 12.1.3. |
Step 2 | Evaluate mental status and highest integrative functioning (Table 12.2). |
Step 3 | Identify any difficulty with comprehension and the use of language (Table 12.3.1 and Table 12.3.2). Use the higher of the WPI ratings from these two tables. |
Step 4 | Evaluate any emotional or behavioural disturbances, such as depression, that can modify cerebral function (Table 12.4). |
Step 5 | Identify the most severe cerebral impairment from steps 1 to 4 above. Combine the most severe WPI rating with WPI ratings from any tables in Chapter 12 including and following Table 12.5.1, or with WPI ratings from other chapters. |
‘Activities of daily living’ are those that an employee needs to perform to function in a non-specific environment (that is, to live). Performance of activities of daily living is measured by reference to primary biological and psychosocial function.
For the purposes of Chapter 12, activities of daily living are those in Figure 12-A on the following page.
Figure 12-A: Activities of daily living
Activity | Examples |
Self care, personal hygiene | Bathing, grooming, dressing, eating, eliminating. |
Communication | Hearing, speaking, reading, writing, using keyboard. |
Physical activity | Standing, sitting, reclining, walking, stooping, squatting, kneeling, reaching, bending, twisting, leaning, carrying, lifting, pulling, pushing, climbing, exercising. |
Sensory function | Tactile feeling. |
Hand functions | Grasping, holding, pinching, percussive movements, sensory discrimination. |
Travel | Driving or travelling as a passenger. |
Sexual function | Participating in desired sexual activity. |
Sleep | Having a restful sleep pattern. |
Social and recreational | Participating in individual or group activities, sports activities, hobbies. |
Notes regarding station, gait and movement disorders
Station, gait and movement disorders:
- station and gait disorders affecting the lower extremities are to be assessed under Table 9.7: Lower extremity function (see Chapter 9—Musculoskeletal system)
- movement disorders affecting the upper extremities are to be assessed under Table 9.14: Upper extremity function (see Chapter 9—Musculoskeletal system)
- except as provided for in the case of injury involving spinal cord damage, (see notes to Tables 9.15 – 9.17, Chapter 9—Musculoskeletal system), station, gait and movement disorders may not be combined with any other WPI ratings from Chapter 9 for the same condition, but may be combined with other WPI ratings under Chapter 12.
Table 12.1.1 applies to stupor, coma, and permanent vegetative state. These conditions are assessed based on clinical findings on neurological examination and relevant ancillary testing such as CT scan, MRI, SPECT, EEG, evoked potentials and vestibular testing.
Table 12.1.1: Permanent disturbances of levels of consciousness and awareness
% WPI | Criteria |
10 - 15 | Mild persistent alteration of state of consciousness limiting ability to perform some activities requiring alertness but not interfering with self care. |
30 | Moderate persistent alteration of state of consciousness limiting ability to perform most activities of daily living including self care. |
70 | Semi-comatose state with complete dependence on others for self care and subsistence. |
95 | Persistent vegetative state or coma requiring total medical support in a specialised care facility. |
Notes to Table 12.1.1
- Assessors should refer to the Principles of Assessment for guidance on awarding an impairment value within a range.
Table 12.1.2 is used for episodic neurological disorders of consciousness and awareness.
Table 12.1.2: Epilepsy, seizures and convulsive disorders
% WPI | Criteria |
10 | Paroxysmal disorder with predictable characteristics but unpredictable occurrence and frequency and severity of attacks which place some restrictions on activities of daily living and may constitute a risk to the employee or others. |
20 | Paroxysmal disorder with predictable characteristics but unpredictable occurrence and frequency and severity of attacks which place many restrictions on activities of daily living and constitutes a risk to the employee or others. |
40 | Severe paroxysmal disorder of such frequency and severity that it limits activities of daily living to those that are supervised or protected. |
70 | Severe, uncontrollable paroxysmal disorder of such severity that it totally restricts the employee’s daily activities—full time care and supervision are required. |
Arousal and sleep disorders include disorders related to:
- initiating and maintaining sleep, or inability to sleep
- excessive somnolence, including sleep-induced respiratory impairment
- sleep-wake schedules.
Central sleep apnoea should be assessed using Table 12.1.3 below. Obstructive sleep apnoea should be assessed using Table 2.4: Whole person impairment derived from obstructive sleep apnoea score (see page 50, Chapter 2—The respiratory system).
Table 12.1.3: Sleep and arousal disorders
See notes to Table 12.1.3 immediately following the table.
% WPI | Criteria |
10 | Reduced daytime alertness placing some restrictions on activities of daily living, performance of which might constitute a risk to the employee. |
20 | Reduced daytime alertness placing many restrictions on activities of daily living and constituting a risk to the employee. |
40 | Reduced daytime alertness of such severity that it limits activities of daily living to those that are supervised or protected. |
60 | Severe reduction in daytime alertness which totally restricts the employee’s daily activities. Full time care and supervision are required. |
Notes to Table 12.1.3
1. Supervision means the immediate presence of a suitable person, responsible in whole or in part for the care of the employee.
2. Suitable person means a person capable of responsibly caring for the employee in an appropriate way.
WPI ratings in Table 12.2 reflect increasing levels of severity. To satisfy particular WPI rating requirements, the majority of criteria for each WPI rating should be present, as described in Figure 12-B (see following page).
The WPI ratings are incremental. In order to satisfy the criteria for a particular degree of impairment, the employee must have a greater degree of impairment than that described for the preceding levels.
The clinical dementia rating (CDR) test for memory, abstract reasoning and problem solving (Figure 12-B) should be administered by a professional competent in the area.
The employee’s cognitive function for each category (memory, orientation, judgement and problem solving, community affairs, home and hobbies, personal care) is scored independently. For the purposes of assessing impairment, memory is considered the primary category. The other categories are secondary.
The following rules apply to scoring:
- if at least three secondary categories are given the same numeric score as memory, then the clinical dementia rating equals the memory score (CDR=M)
- if three or more of the secondary categories are given a score greater than or less than that for memory, then CDR is increased or decreased from M by one level as applicable
- however, if three secondary categories are scored one side of M, and two are scored on the other side of M, then CDR=M.
Find the row in Table 12.2 that exactly matches the respective scores for CDR and memory. The WPI rating is shown in the first column of that row.
Table 12.2: Impairment of memory, learning, abstract reasoning and problem solving ability
% WPI | CDR Score | Memory Score |
0 | 0 | 0 |
3 | 0.5 | 0 |
7 | 0.5 | 0.5 |
10 | 0.5 | 1.0 |
15 | 1.0 | 0.5 |
20 | 1.0 | 1.0 |
25 | 1.0 | 2.0 |
30 | 2.0 | 1.0 |
40 | 2.0 | 2.0 |
45 | 2.0 | 3.0 |
55 | 3.0 | 2.0 |
70 | 3.0 | 3.0 |
Figure 12-B: Clinical dementia rating (CDR)
From American Medical Association’s Guides to the Evaluation of Permanent Impairment 5th edition, 2001.
| Impairment level and CDR score (most of the criteria for a particular WPI rating should be present) |
Category | None 0 | Questionable 0.5 | Mild 1.0 | Moderate 2.0 | Severe 3.0 |
Memory (M) | No memory loss or slight inconsistent forgetfulness. | Consistent slight forgetfulness; partial recollection of events; ‘benign’ forgetfulness. | Moderate memory loss; more marked for recent events; defect interferes with everyday activities. | Severe memory loss; only highly learned material retained; new material rapidly lost. | Severe memory loss; only fragments remain. |
Orientation (O) | Fully oriented. | Fully oriented, except for slight difficulty with time relationships | Moderate difficulty with time relationships; oriented for place at examination; may have geographic disorientation elsewhere. | Severe difficulty with time relationships; usually disoriented to time, often to place. | Oriented to person only. |
Judgement and problem solving (JPS) | Solves everyday problems and handles business and financial affairs well; judgement good in relation to past performance. | Slight impairment in solving problems, similarities and differences. | Moderate difficulty in handling problems, similarities and differences; social judgement usually maintained. | Severely impaired in handling problems, similarities and differences; social judgement usually impaired. | Unable to make judgements or solve problems. |
| Impairment level and CDR score (most of the criteria for a particular WPI rating should be present) |
Category | None 0 | Questionable 0.5 | Mild 1.0 | Moderate 2.0 | Severe 3.0 |
Community affairs (CA) | Independent function at usual level in job, shopping, volunteer and social groups. | Slight impairment in these activities. | Unable to function independently at these activities although may still be engaged in some; appears normal to casual inspection. | No pretence of independent function outside home; appears well enough to be taken to functions outside a family home. | No pretence of independent function outside home; Appears too ill to be taken to functions outside the employee’s family home. |
Home and hobbies (HH) | Life at home, hobbies and intellectual interests well maintained. | Life at home, hobbies and intellectual interests slightly impaired. | Mild but definite impairment of function at home; more difficult chores abandoned; more complicated hobbies and interests abandoned. | Only simple chores preserved; very restricted interests, poorly maintained. | No significant function in home. |
Personal care (PC) | Fully capable of self care. | Fully capable of self care. | Needs prompting. | Requires assistance in dressing, hygiene, keeping of personal effects. | Requires much help with personal care; frequent incontinence. |
Source: Morris JC, 1993, ‘The Clinical Dementia Rating (CDR): current version and scoring rules’, Neurology, 43(11): 2412-2414.
Communication involves comprehension, understanding, language, and effective interaction between and among individuals. Aphasia is a condition in which language function is defective or absent. It includes a lack of comprehension with deficits in vision, hearing, and language (both spoken and written), and also the inability to implement discernible and appropriate language symbols by voice, action, writing or pantomime. Dysphasia is a language impairment that is less severe that aphasia (which literally means ‘no speech’) but still is associated with a lesion in the dominant parietal lobe. It presents as a communication problem due to receptive or expressive dysphasia or a combination of the two. Inability to have a meaningful conversation because no nouns are used is an example of dysphasia. Other common errors include errors of grammatical structure, word-finding difficulties, and word substitution. Dysphasia and aphasia are different from dysarthria, which is imperfect articulation of speech due to disordered muscle control. Dysphonia is an impairment of sound production that causes difficulty speaking and understanding. Speech and communication impairments due to non neurological primary problems are discussed in Chapter 11—Ear, nose, throat and related structures.
Dysphasia is the most common diagnosis, since most individuals usually retain some ability to communicate. An inability to understand language has a poorer prognosis than an inability to express language. Speech therapy is of little value in the absence of comprehension; therefore, compensatory techniques may not be learned when a receptive aphasia or dysphasia exists. Tests for dysphasia should be conducted after it is established how confused or disoriented the individual is and which side of the brain is dominant for speech. Cognition should also be evaluated after dysphasia mechanisms have been excluded.
Aphasia and dysphasia test batteries are frequently devised by the clinician and cover the following simple tasks: (1) listening to spontaneous speech or responses to simple questions; (2) pointing commands and questions that can be answered ‘yes’ or ‘no’ to test comprehension; (3) repeating words and phrases; (4) naming objects that have high-and-low frequency use; (5) reading comprehension and reading aloud (reading is related to educational achievement, which must be known before interpreting reading comprehension and reading aloud results); and (6) writing and spelling. If comprehension is relatively intact, the aphasia screening battery may be adequate to place an individual in class 1 or 2. However, individuals with dysphasia may score poorly on aphasia and dysphasia test batteries while they demonstrate communicative competency for activities of daily living. This communicative competency may be measured by means of the communicative abilities in daily living (CADL), in which non verbal communication is assessed. Table 12.3 describes the criteria for rating impairment due to aphasia or dysphasia.
Table 12.3: Criteria for rating impairment due to aphasia or dysphasia
% WPI | Criteria |
5 | Minimal disturbance in comprehension and production of language symbols of daily living. |
10 | Moderate impairment in comprehension and production of language symbols of daily living. |
32 | Able to comprehend non verbal communication; production of unintelligible or inappropriate language for daily activities. |
50 | Complete inability to communicate or comprehend language symbols. |
Emotional or behavioural disorders resulting from verifiable neurological impairments (for example, stroke or head injury) are assessed under Table 12.4 below.
Psychiatric impairments without documented neurological origin are assessed under Chapter 5—Psychiatric conditions. They are not assessed under Table 12.4.
Neurological conditions associated with changes in emotion and affect include:
- right hemisphere infarct and inappropriate jocularity
- left hemisphere infarct and deep dejection, and dysphasia
- left-sided temporolimbic seizure foci and ideational disorders
- right-sided temporolimbic seizure foci and mood disturbances.
The neuropsychiatric inventory (NPI) may be used to assess ‘no cognitive’ behavioural symptoms such as apathy, delusions, dysphoria, agitation/aggression, euphoria, hallucinations, irritability/lability, and aberrant motor behaviour (Cummings et al, 1994).
Table 12.4: Emotional or behavioural impairments
% WPI | Criteria (all required) |
0 | No limitation of activities of daily living and daily social and interpersonal functioning. |
5 | Minor limitation of activities of daily living and daily social and interpersonal functioning attributable to the normal variation in the general population. |
10 | Mild limitation of activities of daily living and daily social and interpersonal functioning. Impairment levels are compatible with most usual functioning. Able to live independently, looks after self adequately, with occasional lapses in grooming and observing nutritional requirements. Existing relationships strained. |
30 | Moderate limitation of some activities of daily living and some daily social and interpersonal functioning. Cannot live independently without regular support. Needs supervision and/or prompting to perform activities of self-care and personal hygiene. Previously established relationships severely strained. |
50 | Severe limitation in performing most activities of daily living. Impairment significantly impedes useful functioning in most daily social and interpersonal functioning |
65 | Severe limitation in performing most activities of daily living. Impairment significantly impedes useful functioning in most daily social and interpersonal functioning. Needs supervised residential care. Unable to form or sustain long-term relationships. |
80 | Completely unable to perform any daily activities, requiring total dependence on another person. Impairment levels preclude all useful functioning. Unable to function within society. |
Notes to Table 12.4
1. Supervision means the immediate presence of a suitable person, responsible in whole or in part for the care of the employee.
2. Suitable person means a person capable of responsibly caring for the employee in an appropriate way.
Unless otherwise indicated, only the highest WPI rating from the preceding four categories (that is all tables in sections 12.1, 12.2, 12.3 and 12.4) may be combined with a WPI rating from one or more tables in the remainder of Chapter 12, and with WPI ratings from other chapters. (For further information about deriving WPI ratings from an assessment of cerebral function, see Steps 1 to 5 in the introduction to Chapter 12).
The WPI ratings in Table 12.5.1 reflect bilateral partial loss of function and total loss of function (anosmia).
A WPI rating made under Table 12.5.1 may not be combined with a WPI rating for the same condition made under Table 7.3: Olfaction and Taste (see Chapter 7—Ear, nose and throat disorders).
Table 12.5.1: The olfactory nerve (I)
% WPI | Criteria |
2 | Bilateral partial loss of function. |
5 | Bilateral total loss of function. |
Dysfunction of these cranial nerves causes impairment of the visual system and is to be assessed under Chapter 6—The visual system.
This is a mixed nerve having sensory fibres to the face, cornea, anterior scalp, nasal and oral cavities, tongue and supratentorial dura mater. It also transmits motor impulses to the muscles of mastication.
Where sensory loss affects more than one division of the nerve with differing severity, the respective values for each affected division may be combined using the combined values chart (see Appendix 1).
If paralysis of the motor fibres of the nerve causes interference with speech, this impairment should be evaluated in accordance with the criteria in Chapter 7—Ear, nose and throat disorders.
Impairment due to chewing and swallowing difficulties is assessed under Table 12.5.6: The glossopharyngeal, vagus, spinal accessory and hypoglossal nerves. For the same condition, WPI ratings derived from Table 12.5.6 may not be combined with WPI ratings from Table 7.7: Chewing and swallowing (see Chapter 7—Ear, nose and throat disorders).
Table 12.5.3: The trigeminal nerve (V)
% WPI | Criteria |
0 | No loss of sensory function. |
3 | Partial loss of sensory function of any one division of the nerve. |
6 | Partial loss of sensory function of any two divisions of the nerve. |
7 | Complete loss of sensory function of any one division of the nerve and/or mild uncontrolled facial neuralgic pain that may interfere with activities of daily living. |
10 | Partial loss of sensory function of all three divisions of the nerve. |
14 | Complete loss of sensory function of any two divisions of the nerve and/or moderately severe, uncontrolled facial neuralgic pain that interferes with activities of daily living. |
20 | Complete loss of sensory function of all three divisions of the nerve and/or severe, uncontrolled, unilateral or bilateral facial neuralgic pain preventing performance of activities of daily living. |
This is a mixed nerve. The motor part innervates the facial muscles of expression and the accessory muscles for chewing and swallowing. The sensory fibres carry tactile sensations from the ear, soft palate and adjacent pharynx, and transmit taste from the anterior two thirds of the tongue.
Impairment due to chewing and swallowing difficulties is assessed under Table 12.5.6: The glossopharyngeal, vagus, spinal accessory and hypoglossal nerves. For the same condition, WPI ratings derived from Table 12.5.6 may not be combined with WPI ratings from Table 7.7: Chewing and swallowing (see Chapter 7—Ear, nose and throat disorders).
Facial nerve injury, complicated by visual changes, such as occur with corneal desiccation and scarring, should rate as a significant impairment. This should be assessed under Chapter 6—The visual system, and may be combined with a WPI rating from Table 12.5.4.
For the same condition, a WPI rating from Table 12.5.4 may not be combined with a WPI rating from Table 7.3: Olfaction and taste (see Chapter 7—Ear, nose and throat disorders).
Table 12.5.4: The facial nerve (VII)
% WPI | Criteria |
3 | Complete loss of taste over anterior two thirds of tongue or mild unilateral facial weakness. |
10-12 | Mild bilateral facial weakness or severe unilateral facial paralysis with 75% or greater facial involvement and inability to control eyelid closure. |
30 | Severe bilateral facial paralysis with 75% or greater facial involvement and inability to control eyelid closure. |
Notes to Table 12.5.4
- Assessors should refer to the Principles of Assessment for guidance on awarding an impairment value within a range.
The auditory nerve has two portions:
- the cochlear portion concerned with hearing
- the vestibular portion concerned with balance and spatial orientation.
Impairment of hearing due to a lesion of the cochlear portion of the nerve should be evaluated under Chapter 7—Ear, nose and throat disorders. A WPI rating derived from Chapter 7 may be combined with a WPI rating from Table 12.5.5.
Lesions of the vestibular portion of the nerve result in vertigo with or without nausea and vomiting.
Table 12.5.5 is used where symptoms are continuous.
To obtain the final WPI rating in the case of episodic disturbances of equilibrium (such as Menière’s disease), apply the modifier from Figure 12-C (see below) to the WPI rating from Table 12.5.5.
Table 12.5.5: The auditory nerve (VIII)
% WPI | Criteria |
0 | Symptoms of vestibular dysequilibrium present without supporting objective findings, and activities of daily living can be performed without assistance. |
5 | Symptoms of vestibular dysequilibrium present with supporting objective findings, and most activities of daily living can be performed without assistance. |
10 | Symptoms of vestibular dysequilibrium present with supporting objective findings, and most activities of daily living, except those of a complex nature (for example, riding a bicycle), or hazardous nature (for example, walking on a roof, girders or scaffolding), can be performed without assistance. |
20 | Symptoms of vestibular dysequilibrium present with supporting objective findings, and assistance is required with most activities of daily living, except self care, walking, and riding in a motor vehicle as a passenger. |
30 | Symptoms of vestibular dysequilibrium present with supporting objective findings, and assistance is required with all activities of daily living, except self care. |
45 | Symptoms of vestibular dysequilibrium present with supporting objective findings, and assistance is required with all activities of daily living, including self care not requiring ambulation. |
60 | Symptoms of vestibular dysequilibrium present with supporting objective findings, and activities of daily living cannot be performed without assistance, including self care. |
80 | Symptoms of vestibular dysequilibrium present with supporting objective findings, and activities of daily living cannot be performed without assistance, including self care, and home confinement is necessary |
Notes to Table 12.5.5
1. Assistance means the immediate presence of a suitable person, responsible in whole or in part for the care of the employee.
2. Suitable person means a person capable of responsibly caring for the employee in an appropriate way.
Figure 12-C: % WPI modifiers for episodic conditions
Signs and symptoms | Modifier |
Absent. | 0.0 |
Intermittent. | 0.2 |
Present on a daily basis for periods aggregating three or more months per year but less than six months per year. | 0.4 |
Present on a daily basis for periods aggregating six or more months per year but less than eight months per year. | 0.6 |
Present on a daily basis for periods aggregating eight months or more per year but less than ten months per year. | 0.8 |
Present on a daily basis for period aggregating ten months per year or more. | 1.0 |
The spinal accessory nerve assists the vagus nerve in supplying some of the muscles of the larynx, and innervates the cervical portions of the sternocleidomastoid and trapezius muscles.
Disorders of these nerves affecting musculoskeletal function should be assessed in accordance with criteria contained in Chapter 9—Musculoskeletal system.
The glossopharyngeal nerve and the vagus nerve are mixed nerves supplying sensory fibres to the posterior third of the tongue, larynx and trachea. Sensory impairment may contribute to difficulties swallowing, breathing and speaking.
The hypoglossal nerve is a motor nerve that innervates the musculature of the tongue.
Dysarthia is a situation where the articulation of the voice mechanism is at fault. Pronunciation is unclear, although the linguistic content and meaning are normal.
Dysphagia is a condition in which the action of swallowing is difficult to perform, painful, or in which swallowed material is delayed in its passage to the stomach. Speech is slowed or slurred and may be completely unintelligible or non-functional. All other causes of difficulty with chewing or swallowing should be assessed using Table 7.7: Chewing and swallowing (see Chapter 7—Ear, nose and throat disorders). For the same condition, WPI ratings from Table 7.7 may not be combined with WPI ratings from Table 12.5.6.
Table 12.5.6: The glossopharyngeal, vagus, spinal accessory and hypoglossal nerves (IX, X, XI and XII)
% WPI | Criteria (one required—different conditions may be assessed separately) |
10 | Mild dysarthria (speech slow or slurred especially when tired). Dystonia (only neurological). Mild dysphagia (coughing on liquids or semi-solid foods). Diet limited to semi-solid or soft foods. Spasmodic torticollis (only neurological). |
25 | Moderately severe dysarthia (speech is laboured, imprecise, and often unintelligible). Speaker is required to repeat often and may need augmentative device to help convey message. Moderately severe dysphagia with nasal regurgitation and aspiration of liquids and semisolid foods. Diet limited to liquid foods. |
50 | Severe dysarthia – speech may be completely unintelligible or non-functional, or intelligible only to familiar people, and only with the aid of an augmentative communication device. Severe dysphagia (inability to swallow food, liquids or manage oral secretions). Regular suctioning required. Ingestion of food requires tube feeding or gastrotomy. |
Where the ability to breathe is impaired because of a neurological impairment, Table 12.6 below may be used. Impairments of the respiratory system not of documented neurological origin are assessed under Chapter 2—The respiratory system. They are not assessed under Table 12.6.
Table 12.6: Neurological impairment of the respiratory system
% WPI | Criteria |
10 | Able to breathe spontaneously but has difficulty performing activities of daily living that require moderate exertion. |
25 | Able to breathe spontaneously but is restricted to sitting, standing or limited walking. |
60 | Able to breathe spontaneously but to such a limited degree that the employee is confined to bed. |
90 | No capacity for spontaneous respiration. |
Where there is loss of bladder control due to a neurological impairment, Table 12.7 may be used.
Impairments of the urinary system not of documented neurological origin are assessed under Chapter 10—Urinary system. They are not assessed under Table12.7.
Documentation by cystometric and other relevant urologic tests may be necessary.
The status of the upper urinary tract must also be considered. Except for an impairment of bladder function, if several impairments of the urinary system are present, a WPI rating from Table 12.7 may be combined with a WPI rating from Chapter 10—Urinary system.
Table 12.7: Neurological impairment of the urinary system
% WPI | Criteria |
5 | Some degree of voluntary control but impaired by urgency or intermittent incontinence. |
10 - 15 | Good bladder reflex activity, limited capacity, and intermittent emptying without voluntary control. |
30 | Poor bladder reflex activity, intermittent dribbling, and no voluntary control. |
50 | No reflex or voluntary control of the bladder. |
Notes to Table 12.7
- Assessors should refer to the Principles of Assessment for guidance on awarding an impairment value within a range.
Where there is loss of ability to control emptying because of a neurological impairment, Table 12.8 below may be used. Impairments of the anorectal system not of documented neurological origin are assessed under Chapter 8—The digestive system. They are not assessed under Table 12.8.
Table 12.8: Neurological impairment of the anorectal system
% WPI | Criteria |
10 | Reflex regulation but only limited voluntary control. |
20 | Reflex regulation but no voluntary control. |
40 | No reflex regulation or voluntary control. |
Where there is loss of awareness and the capability of having an orgasm because of a neurological impairment, Table 12.9 below may be used. Impairments of sexual function not of documented neurological origin are not assessed under Table 12.9. They are assessed under Chapter 11—The reproductive system.
The employee’s previous sexual functioning should be considered.
Impairment of the peripheral nervous system is assessed using the methodology for assessing the lower and upper extremities described in Chapter 9—The musculoskeletal system.
Table 12.9: Neurological impairment affecting sexual function
% WPI | Criteria |
10 | Sexual functioning is possible, but with difficulty of erection or ejaculation in men, or lack of awareness, excitement or lubrication in either sex. |
15 | Reflex sexual functioning is possible, but there is no awareness. |
20 | No sexual functioning. |
13.0 Introduction
13.1 Anaemia
13.2 Leukocyte abnormalities or disease
13.3 Haemorrhagic disorders and platelet disorders
13.4: Thrombotic disorders
In conducting an assessment, the assessor must have regard to the principles of assessment (see pages 23-26) and the definitions contained in the glossary (see pages 27-28).
Iron deficiency anaemia and megaloblastic anaemia are generally manageable with proper treatment and should not cause permanent impairment. Some haemolytic anaemias are reversible with appropriate therapy, such as steroids or splenectomy, and also should result in negligible impairment.
The impairment resulting from persistent refractory anaemia, whether haemolytic or aplastic, is assessed using Table 13.1.
Table 13.1: Anaemia
See note to Table 13.1 immediately following the table.
% WPI | Haemoglobin level | Transfusion requirements |
0 | 100-120g/L | None |
10 | 80-100g/L | None |
20 | 80-100g/L | 2 Units every 6 weeks |
40 | <80g/L | 2-3 Units every 4 to 6 weeks |
60 | <80g/L | 2-3 Units every 2-3 weeks |
Note to Table 13.1.
1. The haemoglobin levels referred to in Table 13.1 are the levels prior to transfusion.
Chronic low white cell counts (for example, neutropenia) are usually associated with substantially increased risk of infection. Impairment is measured in terms of the infection.
Neoplastic disorders of leukocytes include leukaemias, lymphomas, multiple myeloma, and macroglobulinaemia. Some of these disorders (chronic lymphatic leukaemia, hairy cell leukaemia, and some lymphomas) may cause no impairment for many years.
Similarly, multiple myeloma and macroglobulinaemia may be initially asymptomatic, and cause no gastrointestinal haemorrhage, bone pain, or need for chemotherapy or radiation.
The impairment should be assessed by reference to the appropriate chapters of this guide.
As the early stages of HIV infection are not likely to manifest in impaired organ systems, Table 13.2 alone should be used to assess any impairment. Where organ systems are impaired as the disease progresses, impairment should be assessed using those chapters of the guide which assess impairment of the principal organ systems affected by the disease: including, but not limited to, Chapter 2—The respiratory system, Chapter 8—The digestive system, Chapter 10—The urinary system, and Chapter 12—The neurological system. If several systems are involved, the WPI ratings derived for each system are combined using the combined values chart (see Appendix 1).
The combined impairment should then be compared with the WPI rating from Table 13.2 in order to ascertain the more beneficial WPI rating.
The contribution of side effects of drug treatment to overall impairment should also be considered.
The same principle applies to other conditions of the haematopoietic system where organ systems are impaired by the disease process and impairment can be assessed using other chapters of the guide.
‘Activities of daily living’ are activities which an employee needs to perform to function in a non-specific environment (that is, to live). Performance of activities of daily living is measured by reference to primary biological and psychosocial function.
For the purposes of Table 13.2: Leukocyte abnormalities or disease (see following page), activities of daily living are those in Figure 13-A on the following page.
Figure 13-A: Activities of daily living
Activity | Examples |
Self care, personal hygiene | Bathing, grooming, dressing, eating, eliminating. |
Communication | Hearing, speaking, reading, writing, using keyboard. |
Physical activity | Standing, sitting, reclining, walking, stooping, squatting, kneeling, reaching, bending, twisting, leaning, carrying, lifting, pulling, pushing, climbing, exercising. |
Sensory function | Tactile feeling. |
Hand functions | Grasping, holding, pinching, percussive movements, sensory discrimination. |
Travel | Driving or travelling as a passenger. |
Sexual function | Participating in desired sexual activity. |
Sleep | Having a restful sleep pattern. |
Social and recreational | Participating in individual or group activities, sports activities, hobbies. |
Table 13.2: Leukocyte abnormalities or disease
% WPI | Criteria (all required) |
0 | Signs of leukocyte abnormality but no symptoms. No or infrequent treatment needed. All the activities of daily living can be performed. |
10 | Signs and symptoms of leukocyte abnormality. Infrequent treatment needed. Almost all the activities of daily living can be performed. |
20 | Signs and symptoms of leukocyte abnormality. Continuous or regular treatment needed. Most of the activities of daily living can be performed. |
30 | Signs and symptoms of leukocyte abnormality. Continuous or regular treatment needed. Interference with the performance of the activities of daily living to the extent that some assistance from others is required. |
50 | Signs and symptoms of leukocyte abnormality. Continuous or regular treatment needed. Interference with the performance of the activities of daily living to the extent that considerable assistance from others is required. |
70 | Signs and symptoms of leukocyte abnormality. Continuous or regular treatment needed. Interference with the performance of the activities of daily living to the extent that continuous assistance from others is required. |
80 | Signs and symptoms of leukocyte abnormality. Continuous or regular treatment needed. Totally dependent on others for performance of all activities of daily living. |
Notes to Table 13.2
1. Assistance means the immediate presence of a suitable person, responsible in whole or in part for the care of the employee.
2. Suitable person means a person capable of responsibly caring for the employee in an appropriate way.
Thrombocytopenia does not constitute an impairment unless severe and not reversible by steroids, splenectomy, or other therapy.
A bleeding disorder that causes problems only after trauma or surgery does not constitute a permanent bleeding impairment.
Where an injury is made more severe by the presence of an underlying bleeding disorder, a combined WPI rating is allowed, incorporating values for bleeding sites or organ damage. A WPI rating obtained from tables in other chapters may be combined with a WPI rating obtained from Table 13.3.
Other complications of bleeding disorders, including gastrointestinal, mucosal or intramuscular haemorrhage, should also be assessed according to the site of the blood loss under other Chapters of the guide, including Chapter 8—The digestive system, and/or Table 13.1: Anaemia.
A WPI rating obtained from other tables in this guide should be combined with a WPI rating obtained from Table 13.3 below.
Table 13.3: Haemorrhagic disorders and platelet disorders
% WPI | Criteria |
0 | Splenectomy or easy bruising. |
10 | Continuous or regular medication is required. |
25 | Refractory thrombocytopenia <20,000/L. |
Long-term prophylaxis means prophylaxis continuing for at least two years.
Employees who have permanent respiratory or cardiac limitations secondary to massive pulmonary embolism should be assessed as appropriate under Chapter 1—The cardiovascular system, and Chapter 2—The respiratory system.
For specific levels of impairment for post-thrombotic syndrome, use Table 1.4: Peripheral vascular disease of the lower extremities, or Table 1.6: Raynaud’s disease, Chapter 1—The cardiovascular system). These tables may be used as an alternative. WPI ratings from Tables 1.4 or 1.6, and Table 13.4, must not be combined.
Tables 1.5 and 1.6 should be used as the primary guide for assessing peripheral complications of thrombosis.
Table 13.4: Thrombotic disorders
% WPI | Criteria |
0 | Superficial thrombosis or thrombophlebitis. |
10 | Deep venous or other thrombosis requiring long-term prophylaxis with warfarin. |
30 | Post-phlebitic syndrome. |
The degree of non-economic loss is to be assessed in accordance with Division 2.
The compensation payable for non-economic loss is divided into two equal amounts.
The worksheet—calculation of non-economic loss (see section B6) uses the following formula to calculate the total payable in an individual case:
A + B = $Total
WHERE A = the percentage assessment of total permanent impairment, multiplied by the first half of the maximum
AND B = a reasonable percentage of the second half of the maximum having regard to the non-economic loss suffered
Listed below are the tables in Division 2 used to calculate a reasonable percentage.
Pain:
Table B1—Pain
Suffering:
Table B2—Suffering
Loss of amenities:
Table B3.1—Mobility
Table B3.2—Social relationships
Table B3.3—Recreation and leisure activities
Other loss:
Table B4—Other loss
Loss of expectation of life:
Table B5—Loss of expectation of life.
Scores derived from these tables are then transferred to the worksheet—calculation of non-economic loss (see section B6).
Using Table B1, a score out of five is assessed for pain.
Using the worksheet—calculation of non-economic loss (see section B6), the score for pain is combined with the scores derived from Tables B2, B3.1, B3.2, B3.3, B4 and B5.
Pain means physical pain.
Only ongoing pain of a continuing or episodic nature is considered.
This table does not include temporary pain. Nor does it include speculation of future pain that has not yet manifested itself.
In Table B1, VAPS means ‘visual analogue pain scale’, with 0 being no pain, and 10 being the worst pain ever experienced.
Table B1: Pain
Score | Description of level of effect |
0 | No pain experienced. VAPS = 0 |
1 | Intermittent attacks of pain of nuisance value only. Can be ignored when activity commences. VAPS = 1-2 |
2 | Intermittent attacks of pain. Not easily tolerated, but short-lived. Pain responds fairly readily to treatment (for example, analgesics, anti-inflammatory medications). VAPS = 3-4 |
3 | Episodes of pain more persistent. Not easily tolerated. Treatment, if available, of limited benefit. VAPS = 5-6 |
4 | Pain occurring most of the time. Restrictions on activity. Resistant to treatment. VAPS = 7-8 |
5 | Pain continuous and severe. Preventing activity. Uncontrolled by medication. VAPS = 9-10 |
Using Table B2, a score out of five is assessed for suffering.
Using the worksheet—calculation of non-economic loss (see section B6), the score for Suffering is combined with the scores derived from Tables B1, B3.1, B3.2, B3.3, B4 and B5.
Suffering means the mental distress resulting from the accepted conditions or impairment.
It includes emotional symptoms which are within the normal range of human responses to distressing events such as grief, anguish, fear, frustration, humiliation, embarrassment.
Only ongoing suffering of a continuing or episodic nature is considered.
Table B2 does not include:
- temporary suffering
- speculation about future suffering that has not yet manifested itself.
Table B2: Suffering
Score | Description of level of effect |
0 | No symptoms of mental distress experienced. |
1 | Symptoms of mental distress minimal or ill defined. Symptoms occur intermittently. No interference with activity. |
2 | Distinct symptoms of mental distress which are episodic in nature. Activities reduced during such episodes. Recovers quickly after episodes. |
3 | Symptoms of mental distress are distinct and varied. Episodes of mental distress occur regularly. Ability to cope or perform activity effectively reduced during episodes. Needs time to recover between episodes. Treatment—medication such as anti-depressants, counselling or other therapy by a psychologist or psychiatrist, or other supportive therapy—is of benefit in controlling or relieving symptoms. |
4 | Symptoms of mental distress are wide ranging and tend to dominate thinking. Rarely free of symptoms of mental distress. Difficulty coping or performing activity. Treatment necessary either to control or relieve symptoms. |
5 | Symptoms of mental distress arising from accepted condition interferes with normal thought processes. Activities severely restricted. Treatment of no real benefit in controlling or relieving symptoms. |
‘Loss of amenities’ is also known as ‘loss of enjoyment of life’.
Loss of amenities and leisure activities means the effects on mobility, social relationships and recreation.
A score out of five is assessed for each of the following:
- Mobility (using Table B3.1—Mobility below). ‘Mobility’ refers to the employee’s ongoing ability to move around in his or her environment. This includes walking, driving, being a passenger, using public transport
- Social relationships (using Table B3.2—Social relationships, see following page). ‘Social relationships’ refers to the employee’s ongoing capacity to engage in usual social and personal relationships
- Recreation and leisure activities (using Table B3.3—Recreation and leisure activities, see following page). ‘Recreation and leisure activities’ refers to the employee’s ongoing ability to maintain customary recreational and leisure pursuits.
Using the worksheet—calculation of non-economic loss (see section B6), these scores are then combined with the scores derived from Tables B1, B1, B4 and B5.
Table B3.1: Mobility
Score | Description of level of effect |
0 | No or minimal restrictions on mobility. |
1 | Periodic effects on mobility, resulting in the need for some assistance or effects continuing but mild (such as slowing of pace or the need for a walking stick). |
2 | Mobility reduced, but remains independent of others both within and outside the home. Can travel but may require rest breaks, special seating, or other special treatment. |
3 | Mobility markedly reduced. Needs some assistance from others. Unable to use most forms of transport. |
4 | Restricted to home and vicinity. Can only travel outside home with door to door transport and the assistance of others. |
5 | Severely restricted mobility (for example, bed, chair, room). Dependent on others for assistance. Mechanical devices or appliances used for mobility within the home (for example, wheelchair, hoist). |
Table B3.2: Social relationships
Score | Description of effect |
0 | Usual relationships unaffected. |
1 | Minor interference with personal relationships, causing some reduction in social activities and contacts. |
2 | Relationships confined to immediate and extended family and close friends, but unable to relate to casual acquaintances. |
3 | Difficulty in maintaining relationships with close friends and the extended family. |
4 | Social contacts confined to immediate family. |
5 | Difficulties relating socially to anyone. |
Table B3.3: Recreation and leisure activities
Score | Description of effect |
0 | Able to follow usual recreation and leisure activities |
1 | Intermittent interference with activities. In between episodes able to pursue usual activities. |
2 | Interference to activities reduces frequency of activity, but is able to continue. Is able to follow alternatives. |
3 | Unable to continue with pre-injury level of activity. Alternative activity possible. |
4 | Range of pre-injury activities greatly reduced. Needs some assistance to participate in pre-injury recreation and leisure activities. |
5 | Unable to undertake any pre-injury recreation and leisure activities. |
Table B4 is used to assess losses of a non-economic nature that are not adequately covered by Tables B1, B2, B3.1, B3.2, B3.3, or B5.
A score out of three is assessed.
Using the worksheet—calculation of non-economic loss (see section B6), this score is then combined with the scores derived from Tables B1, B2, B3.1, B3.2, B3.4, and B5.
Table B4: Other loss
Score | Description of effect |
0 | Nil or minimal disadvantages. |
1 | Moderate disadvantages. For example, dependence upon a specialised diet; detrimental effects of climatic features including temperature, humidity, ultra-violet rays, light, noise, dust. |
2 | Marked disadvantages. For example, requirement to move to specially modified premises. |
3 | Severe disadvantages. For example, dependence upon external life saving or supporting machines including aspirator, respirator, dialysis machine, or any form of electro-mechanical device for the sustenance or extension of activities. |
A score out of three is assessed.
Using the worksheet—calculation of non-economic loss (see section B6), this score is then combined with the scores derived from Tables B1, B1, B3.1, B3.2, B3.3, and B4.
Loss of expectation of life is restricted to a maximum of three points because of the value placed on it by the courts in damages cases.
Table B5: Loss of expectation of life
Score | Description of effect |
0 | Loss of life expectancy of less than one year. |
1 | Loss of life expectancy of one year to less than 10 years. |
2 | Loss of life expectancy of 10 years to less than 20 years. |
3 | Loss of life expectancy of 20 years or greater. |
This worksheet allows for the calculation of the percentage of non-economic loss suffered by the employee for the purposes of section 27 of the SRC Act.
B6: Worksheet—calculation of non-economic loss
STEP 1 – Calculation of total score from Division 2 tables
Table | Score | Factor | Final score |
Table B1: Pain | | x 0.5 = | |
|
Table B2: Suffering | | x 0.5 = | |
|
B3: Amenities of life B3.1: Mobility score | | x 0.6 = | |
B3.2: Social relationships | | x 0.6 = | |
B3.3: Recreation and leisure activities | | x 0.6 = | |
|
Table B4: Other loss | | x 1.0 = | |
|
Table B5: Loss of expectation of life | | x 1.0 = | |
|
Total of scores = | |
STEP 2—Conversion of total of scores to a percentage
Choose either Step 2.1 or Step 2.2 |
Step 2.1 If the total of scores from Step 1 above: - equals 15; or
- is greater than 15
then the percentage non-economic loss suffered by the employee is 100%. |
Or |
Step 2.2 If the total of scores from Step 1 above is less than 15, insert in the grey shaded area below the total of scores from Step 1 above. Complete the calculation to find the percentage non-economic loss suffered by the employee: __________ x 100 = ____% 15 |
Use the following worksheet to derive the total entitlement.
C1: Worksheet—calculation of total entitlement
Benefit levels are available from Comcare. They are indexed annually on 1 July in accordance with movements in the Consumer Price Index.
Calculate total whole person impairment entitlement |
Step one | Calculate ss24(9) indexed amount for permanent impairment: WPI% x $ | $ |
|
Step two | Calculate part A of ss27(2) indexed amount for non-economic loss: WPI% x $ | $ |
|
Step three | Calculate part B of ss27(2) indexed amount for non-economic loss: _____ % Non-economic loss (from B6) x $ | $ |
|
Step four | Total permanent impairment entitlement: | $ |
The values are derived from the formula:
A + B(1-A) = combined value of A and B
where A and B are the decimal equivalents of the WPI ratings
In the chart all values are expressed as percentages. To combine any two impairment values, locate the larger of the values on the side of the chart and read along that row until you come to the column indicated by the smaller value at the bottom of the chart. At the intersection of the row and the column is the combined value.
For example, to combine 35% and 20%, read down the side of the chart until you come to the larger value, 35%. Then read across the 35% row until you come to the column indicated by 20% at the bottom of the chart. At the intersection of the row and column is the number 48. Therefore, 35% combined with 20% is 48%. Because of the construction of this chart, the larger impairment value must be identified at the side of the chart.
If three or more impairment values are to be combined, sort the impairment values from highest to lowest, select the highest and find their combined values as above. The use that combined value and the third highest impairment value to locate the combined value of all.
This process can be repeated indefinitely, the final value in each instance being the combination of all the previous values. In each step of this process the larger impairment value must be identified at the side of the chart.
Division 1—Assessment of degree and employee’s permanent impairment resulting from injury
1. Cardio-vascular system
Table 1.1: Symptomatic activity levels 246
Table 1.2: Peripheral vascular disease 247
Table 1.3: Varicose veins, deep venous thrombosis, oedema, ulceration 248-249
2. Respiratory system
Table 2.1: Ventilatory function 250
Figure 2.1: Prediction nomogram (males) 251
Figure 2.2: Prediction nomogram (females) 252
3. Endocrine system
Table 3.1: Endocrine system 253
4. Disfigurement and skin disorders
Table 4.1: Functional loss 254
Table 4.2: Facial disfigurement 255
5. Psychiatric disorders
Table 5.1: Personality disorders, psychoneuroses, psychoses, etc 256-257
6. Visual system
Table 6.1: Visual acuity disorders 258
7. Ear, nose and throat disorders
Table 7.1: Hearing 259
Table 7.2: Miscellaneous 260
8. Digestive system
Table 8.1: Oesophagus, stomach, duodenum, small intestine, pancreas, colon, rectum and anus 261-262
Table 8.2: Disorders of the liver and biliary tract 263
Table 8.3: Fistulae and herniae 264
9. Musculo-skeletal system
Table 9.1: Upper extremity 265
Table 9.2: Lower extremity 266
Table 9.3: Amputations and total loss of function 267-268
Table 9.4: Limb function—upper limb 269
Table 9.5: Limb function—lower limb 270
Table 9.6: Spine 271
10. Urinary system
Table 10.1: Upper urinary tract 272
Table 10.2: Lower urinary tract 273
11. Reproductive system
Table 11.1: Male 274-275
Table 11.2: Female 276
Table 11.3: Mammary glands 277
12. Neurological function
Table 12.1: Cranial nerves 279
Table 12.2: Comprehension 280
Table 12.3: Expression 282
Table 12.4: Memory 283
Table 12.5: Reasoning 284
13. Miscellaneous
Table 13.1: Intermittent conditions 285
Table 13.2: Malignancies 286
14. Combined values chart
Combined values chart 288-290
Division 2—Non-economic loss
Table 1: Pain and suffering 292-293
Table 2: Loss of amenities 294-296
Table 3: Other loss 297
Table 4: Loss of expectation of life 298
Table 5: Combined Value Calculation 299
Table 6: Final calculation 301-303
Kamburoff Petia L and Woitowitz HJ & RH (1972).
American Medical Association, 2001, Guides to the Evaluation of Permanent Impairment, 5th edition, Chicago: American Medical Association.
PART 2
1. Impairment and non-economic loss
2. Employability and incapacity
3. Permanent
4. The impairment tables
5. Gradations of impairment
6. Combined impairments
7. Double assessment
8. Fingers and toes
9. Inapplicability of Part 2 of this guide
10. Interim assessments
11. Application of Part 2 of the guide
12. Likelihood of reduction in degree of impairment
13. Aggravation
Impairment means ‘the loss, loss of use, damage or malfunction, of any part of the body, bodily system or function or part of such system or function’. It relates to the health status of an individual and includes anatomical loss, anatomical abnormality, physiological abnormality and psychological abnormality. Throughout this guide emphasis is given to loss of function as a basis of assessment of impairment and as far as possible objective criteria have been used. The degree of impairment is assessed by reference to the impact of that loss by reference to the functional capacities of a normal healthy person.
Impairment is measured against its effect on personal efficiency in the ‘activities of daily living’ in comparison with a normal healthy person. The measure of ‘activities of daily living’ is a measure of primary biological and psychosocial function such as standing, moving, feeding and self care.
Non-economic loss, which is assessed in accordance with Part 2, Division 2 of this guide, is a subjective concept of the effects of the impairment on the employee’s life. It includes pain and suffering, loss of amenities of life, loss of expectation of life and any other real inconveniences caused by the impairment.
Whilst ‘activities of daily living’ are used to assess impairment they should not be confused with ‘lifestyle effects’ which are used to assess non-economic loss. ‘Lifestyle effects’ are a measure of an individual’s mobility and enjoyment of, and participation in, recreation, leisure activities and social relationships. It is emphasised that the employee must be aware of the losses suffered. While employees may have equal ratings of impairment it would not be unusual for them to receive different ratings for non-economic loss because of their different lifestyles.
The concepts of ‘employability’ and ‘incapacity’ are not included in the assessment of impairment and non-economic loss. Incapacity is influenced by factors other than the degree of impairment and is compensated by weekly payments which are in addition to these payments.
Permanent means ‘likely to continue indefinitely’. In determining whether an impairment is permanent regard shall be had to:
1 the duration of the impairment
2 the likelihood of improvement in the employee’s condition
3 whether the employee has undertaken all reasonable rehabilitative treatment for the impairment
4 any other relevant matters.
An impairment will generally be regarded as permanent when the recovery process has been completed, i.e. when the full and final effects of convalescence, the natural healing process and active (as opposed to palliative) medical treatment has been achieved.
Part 2, Division 1 of this guide is based on the concept of ‘whole person impairment’ which is drawn from the American Medical Association’s Guides.
Evaluation of a whole person impairment is a medical appraisal of the nature and extent of the effect of an injury or disease on a person’s functional capacity and activities of daily living.
As with the American Medical Association’s Guides, Part 2, Division 1 of this guide is structured by assembling detailed descriptions of impairments into groups according to body system and expressing the extent of each impairment as a percentage value of the functional capacity of a normal healthy person. Thus a percentage value can be assigned to an employee’s impairment by reference to the relevant description in this guide.
Each table contains impairment values at gradations of 5% or multiples of five percent. Where it is not clear which of two impairment values is more appropriate, the relevant authority has the discretion to determine which value properly reflects the degree of impairment.
There is no discretion to choose an impairment value not specified in Part 2 of this guide. For example, where 10% and 20% are specified values there is no discretion to determine impairment as 15%.
Where a table provides for impairment values within a range, consideration will need to be given to all criteria applicable to the condition, which includes performing activities of daily living and an estimate of the degree to which the medical impairment interferes with these activities. In some cases, additional information may be required to determine where to place an individual within the range. The person conducting the assessment must provide written reason why he or she considers the selected point within the range as clinically justifiable.
Impairment is system or function based. A single injury may give rise to multiple loss of function. When more than one table applies to a single injury separate scores should be allocated to each functional impairment. Where there is an initial injury which results in impairment, and a second injury which results in impairment to the same bodily system or function occurs, the pre-existing impairment must be disregarded when assessing the degree of impairment of the second injury. The second injury should be assessed by reference to the functional capacities of a normal healthy person. The final scores are then added together.
The possibility of double assessment for a single loss of function must be guarded against. For example, it would be inappropriate to assess a lower limb amputation by reference to both the amputation table 9.3 and the lower extremity table 9.2 in Part 2, Division 1 of this guide.
Where an employee suffers from more than one impairment arising from the same injury, the values are not added but are combined using the Part 2 combined values table. The purpose of this table is to give the total effect of all impairments, according to a formula, as a percentage value of the employee’s whole bodily system or function.
Impairment relating to the loss or injury to a finger or toe refers not only to amputation or total loss of efficient use of the whole digit, but also to partial loss of efficient use of a digit.
In the unlikely event that an employees’ impairment is of a kind that cannot be assessed in accordance with the provisions of part 2 of this guide, the relevant authority may direct that assessment be made under the provisions of the American Medical Association’s Guide to the Evaluation of Permanent Impairment, 5th edition, 2001.
To ensure that the possibility of entitlement to a permanent impairment payment does not impede the rehabilitation process provision is made for interim assessment and payment of compensation.
Assessment for an interim payment will apply mainly in cases undergoing active treatment where the final outcome of the treatment is not known but a minimum permanent impairment can be measured. Care should be taken to ensure that further treatment will not reduce the impairment which must be at least 10%. Interim payment will generally not apply where the impairment has stabilised or where the only change in impairment would be due to progressive degeneration.
This part deals with the assessment of defence-related claims as defined in Part XI of the SRC Act. That is, claims made under the SRC Act by members of the Defence Force in relation to injuries which occurred during defence service before 1 July 2004.
The responsibility for development of any Guide that applies to members of the Defence Force in respect of injuries incurred after the commencement of the Military Rehabilitation and Compensation Act 2004 (MRC Act) will fall to the Department of Veterans Affairs.
The fact that an injury occurred before 1 December 1988 does not disqualify a claimant from access to a payment for permanent impairment.
- if the impairment became permanent prior to 1 December 1988 entitlement is assessed under the Compensation Commonwealth Government Employees Act 1971
- if the impairment became permanent after 1 December 1988 entitlement is assessed under the SRC Act unless it is to be assessed under the MRC Act.
The relevant authority shall have regard to medical opinion concerning the nature and effect (including possible effect) of the injury and the extent (if any) to which impairment resulting from the injury or non-economic loss resulting from the injury or impairment, may reasonably be capable of being reduced or removed. In particular, regard shall be had to an employee’s unreasonable failure or refusal to act in accordance with medical advice or to submit to medical treatment which would reduce the degree of impairment.
A permanent impairment assessment in respect of an aggravation should not be made unless the effects of an aggravation are considered permanent. If the employee’s impairment is entirely attributable to a pre-existing or underlying condition, or to the natural progression of such a condition the assessment for permanent impairment should be nil.
Where it is possible to isolate the compensable effects of an injury upon a pre-existing or underlying condition the assessment of the degree of permanent impairment should reflect only the impairment due to those compensable effects.
Activities of daily living are those activities that an employee needs to perform to function in a non-specific environment, i.e. to live. The measure of activities of daily living is a measure of primary biological and psychosocial function. They are:
- Ability to receive and respond to incoming stimuli
- Standing
- Moving
- Feeding (includes eating but not the preparation of food)
- Control of bladder and bowel
- Self care (bathing, dressing etc)
- Sexual function.
Ailment means any physical or mental ailment, disorder, defect or morbid condition (whether of sudden onset or gradual development).
Disease means:
(a) an ailment suffered by an employee
(b) an aggravation of such an ailment
that was contributed to, to a significant degree, by the employee’s employment by the Commonwealth or a licensee.
Impairment means the loss, the loss of the use, or the damage or malfunction, of any part of the body or of any bodily system or function or part of such system or function.
Injury means:
(a) a disease suffered by an employee
(b) an injury (other than a disease) suffered by an employee, that is a physical or mental injury arising out of, or in the course of, the employee’s employment
(c) an aggravation of a physical or mental injury (other than a disease) suffered by an employee (whether or not that injury arose out of, or in the course of, the employee’s employment), that is an aggravation that arose out of, or in the course of, that employment
but does not include a disease, injury or aggravation suffered as a result of reasonable administrative action taken in a reasonable manner in respect of the employee’s employment.
Loss of amenities means the effects on mobility, social relationships and recreation and leisure activities.
Non-economic loss means loss or damage of a non-economic kind suffered by the employee (including pain and suffering, a loss of expectation of life or a loss of the amenities or enjoyment of life) of which the employee is aware.
Pain and suffering includes physical pain as well as mental distress resulting from the accepted conditions or impairment. For example, grief, anguish, fear, frustration, humiliation, embarrassment etc.
Glossary continues on following page
Whole person impairment is the methodology used for expressing the degree of impairment of a person, resulting from an injury, as a percentage and is drawn from the American Medical Association Guide to the Evaluation of Permanent Impairment where it is there referred to as ‘whole man’ impairment. Evaluation of whole person impairment is a medical appraisal of the nature and extent of the effect of an injury or disease on a person’s functional capacity and on the activities of daily living. The guides are structured by assembling detailed descriptions of impairments into groups according to body system and expressing the extent of each impairment as a percentage value of the functional capacity of a normal healthy person. Thus, a percentage value can be assigned to an employee’s impairment by reference to the relevant description in this guide.
Table 1.1: Assessments of symptomatic activity levels
(Percentage whole person impairment)
Table of metabolic costs of activities will be provided for purposes of assessment. Examples of conditions with which it can be used are ischaemic heart disease, rheumatic heart disease and hypertension.
Male
Symptomatic level of activity (in METs) |
AGE
(Yrs) | 1 | 1-2 | 2-3 | 3-4 | 4-5 | 5-6 | 6-7 | 7-8 | 8-9 | 10+ |
18-30 | 95 | 80 | 70 | 60 | 50 | 45 | 35 | 25 | 10 | 5 |
31-40 | 95 | 80 | 70 | 60 | 50 | 40 | 30 | 15 | 5 | - |
41-50 | 95 | 75 | 65 | 50 | 40 | 25 | 15 | 5 | - | - |
51-60 | 95 | 75 | 60 | 45 | 30 | 15 | 10 | 5 | - | - |
61-70 | 95 | 70 | 55 | 40 | 25 | 10 | 5 | - | - | - |
70+ | 95 | 65 | 45 | 30 | 10 | - | - | - | - | - |
Female
Symptomatic level of activity (in METs) |
AGE
(Yrs) | 1 | 1-2 | 2-3 | 3-4 | 4-5 | 5-6 | 6-7 | 7-8 | 8-9 | 10+ |
18-30 | 95 | 80 | 65 | 60 | 40 | 25 | 15 | 10 | 5 | - |
31-40 | 95 | 80 | 60 | 45 | 35 | 20 | 5 | - | - | - |
41-50 | 95 | 75 | 60 | 45 | 30 | 15 | 5 | - | - | - |
51-60 | 95 | 75 | 55 | 35 | 20 | 10 | 5 | - | - | - |
61-70 | 95 | 70 | 45 | 30 | 10 | 5 | - | - | - | - |
70+ | 95 | 65 | 30 | 15 | 5 | - | - | - | - | - |
Table 1.2: Peripheral vascular disease
(Percentage whole person impairment)
% | Description of level of impairment |
0 | The claimant experiences neither intermittent claudication nor ischaemic pain at rest. |
5 | The claimant has no difficulty with distances but experiences ischaemic pain on climbing steps or gradients. |
10 | The claimant experiences claudication on walking 200 metres or more at an average walking pace on level ground. |
20 | The claimant experienced claudication on walking more than 100 but less than 200 metres at average pace on level ground. |
30 | The claimant experiences claudication on walking more than 75 but less than 100 metres at average pace on level ground. |
40 | The claimant experiences claudication on walking more than 50 but less than 75 metres at average pace on level ground. |
50 | The claimant experiences claudication on walking more than 25 but less than 50 metres at average pace on level ground. |
60 | The claimant experiences claudication on walking less than 25 metres at average pace on level ground. |
70 | The claimant experiences ischaemic pain at rest. |
Table 1.3: Varicose veins, deep venous thrombosis, oedema, ulceration
(Percentage whole person impairment)
% | Description of level of impairment |
0 | One or more of the following: - varicose veins—may be gross but cause no significant restriction of activities
- oedema—mild or transient
- skin reaction—mild or transient
and minimal limitation of activities of daily living (although exacerbation may temporarily increase the extent of limitation). |
10 | Any one of the following which necessitates intermittent treatment including a short period of admission to hospital or confinement to home: - varicose veins—with recurrent superficial phlebitis
- oedema—persistent and incompletely controlled
- ulceration—superficial, transient.
|
15 | Any two of the following which necessitate intermittent treatment including a short period of admission to hospital or confinement to home: - varicose veins—with recurrent superficial phlebitis
- oedema—persistent and incompletely controlled
- ulceration—superficial, transient.
|
20 | All of the following which necessitate intermittent treatment including a short period of admission to hospital or confinement to home: - varicose veins—with recurrent superficial phlebitis
- oedema—persistent and incompletely controlled
- ulceration—superficial, transient.
|
30 | Any one of the following which needs continuous treatment including periodic admission to hospital or confinement to residence: - deep venous thrombosis
- oedema—marked and only partly controlled by elastic support or medication
- ulceration—persistent, widespread or deep.
|
40 | Any two of the following which need continuous treatment including periodic admission to hospital or confinement to residence: - deep venous thrombosis
- oedema—marked and only partly controlled by elastic support or medication
- ulceration—persistent, widespread or deep.
|
% | Description of level of impairment |
50 | Severe bilateral deep venous thrombosis which needs continuous treatment including long periods of admission to hospital or confinement to residence. |
60 | Any two of the following which need continuous treatment including long periods of admission to hospital or confinement to residence: - severe bilateral deep venous thrombosis
- marked oedema that cannot be controlled
- severe ulceration.
|
Table 2.1: Ventilatory function
(Percentage whole person impairment)
The major test of respiratory impairment is the ventilatory function test or respiratory test. Predictive nomograms for the forced expiratory volume over one second (FEV1) and the forced vital capacity (FVC) are at figures 2.1 (males) and 2.2 (females).
% | Ventilatory function %
of predicted value |
0 | More than 85 |
10 | 85 |
15 | 80 |
20 | 75 |
25 | 70 |
30 | 65 |
35 | 60 |
40 | 55 |
45 | 50 |
50 | 45 |
55 | 40 |
60 | 35 |
65 | 30 |
70 | 25 |
Notes:
X-rays may be normal in any of the above categories. Measurement of FEV1 and Forced Vital Capacity (FVC) should be performed with a Vitalograph® spirometer or equivalent instrument. Three readings should be taken and the largest of these used to calculate impairment.
FIGURE 2.1: Prediction nomogram—males
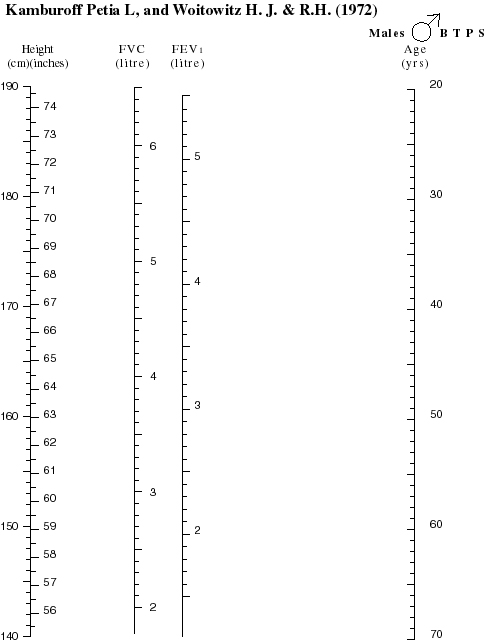
FIGURE 2.2: Prediction nomogram—females
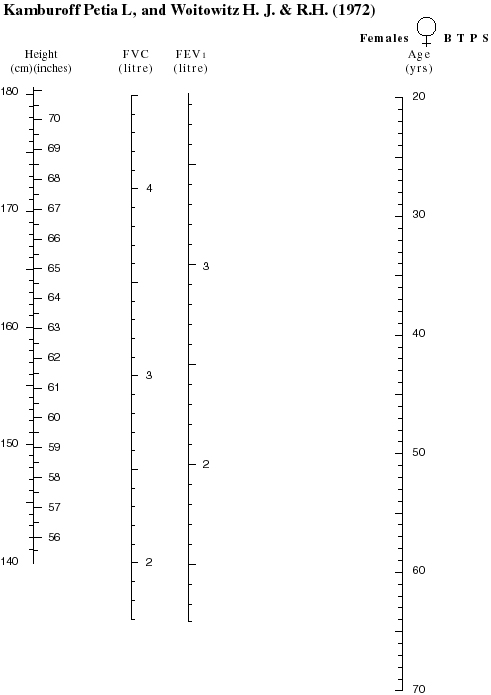
Table 3.1
(Percentage whole person impairment)
The effects of diabetes mellitus in other systems (for example, the vascular and visual systems) should be assessed from the appropriate tables and combined with values from the table above using the combined values table (Table 14.1).
% | Description of level of impairment |
0 | Any one of the following: - thyroid disease adequately controlled with thyroxine replacement
- primary hyperparathyroidism; parathyroid adenoma removed; replacement therapy not indicated
- asymptomatic Paget’s disease
- asymptomatic osteoporosis or other bone disease, with or without treatment.
|
5 | Diabetes mellitus satisfactorily controlled by diet and/or oral medication |
10 | Any one of the following: - thyroid disease which cannot be adequately treated with thyroxine
- primary hyperparathyroidism; parathyroidectomy; replacement therapy required
- symptomatic Paget’s disease
- symptomatic osteoporosis
- other bone disease WITH pain not completely controlled by continuous therapy.
|
15 | Diabetes mellitus requiring dietary adjustment and insulin. |
20 | Diabetes mellitus not satisfactorily controlled despite vigorous therapy. |
Table 4.1 Functional loss
In the evaluation of impairment resulting from a skin disorder the actual functional loss is the prime consideration, rather than the extent of cutaneous involvement. Where the condition affects the face Table 4.2 may be more appropriate.
% | Description of level of impairment |
0 | The condition is absent on examination or if present can easily be reversed by appropriate medication or other treatment and causes no interference with activities of daily living when present. |
5 | The condition requires treatment for lengthy periods but causes no interference with activities of daily living when present. |
10 | The condition is absent on examination or if present can easily be reversed by appropriate medication or treatment and causes minor interference with activities of daily living when present. |
20 | The condition requires treatment for periods in aggregate up to three months per year and causes interference with activities of daily living when present. |
30 | The condition requires treatment for periods in aggregate up to four months per year and causes minor interference with activities of daily living when present. |
40 | The condition requires treatment for periods in aggregate up to four months per year and causes major interference with activities of daily living when present. |
45 | The condition requires treatment for periods in aggregate up to six months per year and causes minor interference with activities of daily living when present. |
50 | The condition requires treatment for periods in aggregate up to six months per year and causes major interference with activities of daily living when present. |
60 | The condition requires treatment for periods in aggregate up to nine months per year and causes major interference with activities of daily living when present. |
70 | The condition requires treatment for periods in aggregate up to nine months per year and causes major interference with activities of daily living when present. |
75
-
100 | The condition is present all the time and requires treatment for between 9 and 12 months of the year and causes major interference with activities of daily living. |
Notes:
Assessors should refer to the Principles of Assessment for guidance on awarding an impairment value within a range.
(Percentage whole person impairment)
When evaluating impairment due to facial injury or disease, three factors need to be considered.
First, the functional components of the face must be evaluated (for example the effects of the condition on communication, respiration, eating, visual function, hearing, etc).
Second, the cosmetic effects should be considered. These are not truly an impairment, but for the purposes of evaluation are deemed to be equivalent to certain impairments. These deemed values are set out below. Cosmetic defects should be assessed when all feasible cosmetic surgery has been completed and should take into account the beneficial effects of the use of cosmetics etc.
Third, facial disfigurement may result in behavioural changes. These should be assessed in accordance with the criteria in Table 5.1 ‘Psychiatric and Behavioural Disorders’.
Where more than one deformity is present from the same band or different bands, a value should be allotted to each and these should be combined using the Combined Values Table (see Appendix 1).
% | Description of level of impairment |
0 | Normal facial appearance or any scarring above the brow line. |
5 | Any of the following: - cutaneous scars or pigmentation
- unilateral facial paralysis
- distortion of the nose
- loss or deformity of the external ear.
|
10 | Any of the following: - disfigurement of the orbit
- bilateral facial paralysis
- depression of the zygoma
- depression of the frontal bones
- severe scarring below the upper lip.
|
15 | Loss of part of nose. |
25 | Loss of the entire nose. |
35 | Severe disfigurement of the entire area between the brow and the upper lip on both sides. |
Table 5.1
Includes psychoses, neuroses, personality disorders and other diagnosable conditions. The assessment should be made on optimum medication at a stage where the condition is reasonably stable.
% | Description of level of impairment |
0 | Reactions to stresses of daily living WITHOUT loss of personal or social efficiency AND retained capability of performing activities of daily living without supervision or assistance. |
5 | Despite the presence of ONE of the following, employee is capable of performing activities of daily living without supervision or assistance: - reactions to stresses of daily living with minor loss of personal or social efficiency
- lack of conscience-directed behaviour without harm to others or self
- minor distortion of thinking.
|
10 | Despite the presence of more than one of the following, employee is capable of performing activities of daily living without supervision or assistance: - reactions to stresses of daily living with minor loss of personal or social efficiency
- lack of conscience-directed behaviour without harm to others or self
- minor distortion of thinking.
|
15 | Any of the following, accompanied by a need for some supervision and direction in activities of daily living: - reactions to stresses of daily living which cause modification of daily living patterns
- marked disturbances in thinking
- definite disturbance in behaviour.
|
20 | Any two of the following, accompanied by a need for some supervision and direction in activities of daily living: - reactions to stresses of daily living which cause modification of daily living patterns
- marked disturbance in thinking
- definite disturbance in behaviour.
|
% | Description of level of impairment |
25 | All of the following, accompanied by a need for some supervision and direction in activities of daily living: - reactions to stresses of daily living which cause modification of daily living patterns
- marked disturbances in thinking
- definite disturbances in behaviour.
|
30 | Any one of the following, accompanied by a need for supervision and direction in activities of daily living: - hospital dischargees who require daily medication or regular therapy to avoid readmission
- loss of self control and/or inability to learn from experience causing considerable damage to self or others.
|
40 | Both of the following, accompanied by a need for supervision and direction in activities of daily living: - hospital dischargees who require daily medication or regular therapy to avoid readmission
- loss of self control and/or inability to learn from experience causing considerable damage to self or others.
|
50 | One of the following: - severe disturbances of thinking and/or behaviour which entails potential or actual harm to self and/or others
- need for supervision and direction in a confined environment.
|
60 | Both of the following - severe disturbances of thinking and/or behaviour which entails potential or actual harm to self and/or others
- need for supervision and direction in a confined environment.
|
90 | Very severe disturbance in all aspects of thinking and behaviour such as to require constant supervision and care in a confined environment and assistance with all activities of daily living. |
Table 6.1: Disorders of visual acuity
(Percentage whole person impairment)
Disorders such as nystagmus, conjunctivitis, impaired colour vision, night blindness and glaucoma (without visual loss) are usually binocular and cause minimal impairment. An assessment of 0 to 5 percent is appropriate for such conditions.
Visual field defects should be accurately mapped and assessed in accordance with the procedures dictated in the 2nd edition of the American Medical Association’s Guides to the Evaluation of Permanent Impairment.
Impairment is based on corrected visual acuity.
Right eye |
L
E
F
T
E
Y
E | | 6/6 | 6/9 | 6/12 | 6/18 | 6/24 | 6/30 | 6/36 | 6/48 | 6/60 | 3/60 | NPL |
6/6 | 0 | 5 | 5 | 10 | 10 | 15 | 15 | 20 | 20 | 20 | 25 |
6/9 | 5 | 10 | 10 | 15 | 15 | 20 | 20 | 25 | 25 | 30 | 30 |
6/12 | 5 | 10 | 20 | 20 | 25 | 25 | 30 | 30 | 35 | 35 | 40 |
6/18 | 10 | 15 | 20 | 30 | 30 | 35 | 35 | 40 | 40 | 40 | 45 |
6/24 | 10 | 15 | 25 | 30 | 40 | 40 | 40 | 45 | 45 | 50 | 50 |
6/30 | 15 | 20 | 25 | 35 | 40 | 45 | 50 | 50 | 55 | 55 | 60 |
6/36 | 15 | 20 | 30 | 35 | 40 | 50 | 55 | 60 | 60 | 65 | 65 |
6/48 | 20 | 25 | 30 | 40 | 45 | 50 | 60 | 65 | 70 | 70 | 75 |
6/60 | 20 | 25 | 35 | 40 | 45 | 55 | 60 | 70 | 75 | 80 | 80 |
3/60 | 20 | 30 | 35 | 40 | 50 | 55 | 65 | 70 | 80 | 85 | 85 |
NPL | 25 | 30 | 40 | 45 | 50 | 60 | 65 | 75 | 80 | 85 | 85 |
Note: NPL means no perceived light.
Table 7.1: Hearing
(Percentage whole person impairment)
Hearing defects are assessed in accordance with the current procedures from the Australian National Acoustic Laboratories.
Once the binaural percentage loss of hearing has been calculated, it is then converted to a whole person impairment value.
The calculation for converting the percentage loss of hearing to a whole person percentage is:
(Percentage loss of hearing)
2 |
Table 7.2: Miscellaneous ear, nose and throat disorders
(Percentage whole person impairment)
% | Description of level of impairment |
0 | One or more of the following: - intermittent otorrhoea
- intermittent otalgia and tinnitus
- post nasal discharge, rhinorrhoea and sneezing
- vertigo which does not interfere with any activities
- other conditions which are controlled by medication or for which no medication is required.
|
5 | Any of the following: - permanent otorrhoea
- complete loss of olfaction or taste
- permanent tinnitus.
|
10 | Any of the following: - permanent otalgia
- vertigo which interferes only with activities involving personal or public safety (for example, driving a car, operating machinery).
|
20 | Vertigo which interferes with activities of daily living. |
25 | Permanent tracheostomy or stoma. |
40 | Vertigo which interferes with all activities except household duties and self care. |
60 | Vertigo which interferes with all activities to the extent that only self care can be managed and all other activity is impossible. |
80 | Vertigo such that the sufferer is confined to home and requires assistance with all activities, including self care. |
Table 8.1: Disorders of the oesophagus, stomach, duodenum, small intestine, pancreas, colon, rectum and anus
(Percentage whole person impairment)
% | Description of level of impairment |
0 | Symptoms present but no anatomical loss or alteration. |
5 | Symptoms and/or signs present and there is anatomical loss or alteration but continuous treatment is not required and weight and nutrition are maintained at normal levels
or
mild incontinence of flatus or liquid stool. |
10 | Objective signs of disease present and at least one of the following: - dietary modification needed for control
- drugs needed for control
- loss of up to 10% of desirable weight per range on standard BMI chart.
|
15 | Objective signs of disease present and at least two of the following: - dietary modification needed for control
- drugs needed for control
- loss of up to 10% of desirable weight per range on standard BMI chart..
|
20 | Partial faecal incontinence requiring continual treatment or objective signs of disease present and all of the following: - dietary modification needed for control
- drugs needed for control
- loss of up to 10% of desirable weight per range on standard BMI chart..
|
25 | Objective signs of disease present and one of the following: - dietary modification and drugs produce partial but incomplete control
- loss of 10 to 20% of desirable weight per range on standard BMI chart..
|
30 | Objective signs of disease present and both of the following: - dietary modification and drugs produce partial but incomplete control
- weight loss of 10 to 20 percent of desirable weight per range on standard BMI chart..
|
% | Description of level of impairment |
40 | Objective signs of disease present with two of the following: - disturbed bowel habit
- pain (periodic or continual)
- continual manifestations (for example, fever or anaemia)
- weight loss of 10 to 20 percent of desirable weight per range on standard BMI chart..
|
45 | Complete faecal incontinence |
50 | Objective signs of disease present with all of the following: - disturbed bowel habit
- pain (periodic or continual)
- continual manifestations (for example, fever or anaemia)
- weight loss of 10 to 20 percent of desirable weight per range on standard BMI chart..
|
55-75 | Objective signs of disease present and a combination of the following: - severe persistent disturbance of bowel habit
- severe persistent pain
- constitutional manifestations
- weight loss of more than 20 percent of desirable weight per range on standard BMI chart.
- severe limitation of activity.
|
Notes:
Assessors should refer to the Principles of Assessment for guidance on awarding an impairment value within a range.
Table 8.2: Disorders of the liver and biliary tract
(Percentage whole person impairment)
% | Description of level of impairment |
0 | Mildly abnormal liver function tests but adequate nutrition and strength with no other signs of disease. |
5 | Episodes of biliary colic twice a year or less frequently. |
10 | Stigmata of liver disease but no history of jaundice, ascites or bleeding oesophageal varices within the last five years. and Liver function tests normal or mildly abnormal. |
15 | Episodes of biliary colic three to five times a year. |
20 | Stigmata of liver disease with jaundice, ascites or bleeding oesophageal varices one to five years ago and liver function tests now normal or mildly abnormal. |
25 | Stigmata of liver disease with jaundice, ascites or bleeding oesophageal varices one to five years ago and liver function tests markedly abnormal. |
40 | Stigmata of liver disease with jaundice, ascites or bleeding oesophageal varices in the past year or objective signs of progressive liver disease. |
50 | Permanent irreparable biliary tract obstruction. |
60 | Objective signs of progressive liver disease with one of the following: - persistent jaundice
- frequent, recurrent bleeding episodes
- central nervous system manifestations of hepatic insufficiency.
|
70 | Objective signs of progressive liver disease with two of the following: - persistent jaundice
- frequent, recurrent bleeding episodes
- central nervous system manifestations of hepatic insufficiency.
|
80 | Objective signs of progressive liver disease with all of the following: - persistent jaundice
- frequent, recurrent bleeding episodes
- central nervous system manifestations of hepatic insufficiency.
|
95 | Hepatic coma. |
Table 8.3: Fistulae and herniae
(Percentage whole person impairment)
% | Description of level of impairment |
5 | Any of the following: - inguinal hernia (readily reducible)
- ventral hernia, well supported.
|
10 | Any of the following: - small recurrent inguinal hernia (operable but not readily reducible)
- colostomy.
|
15 | Any of the following: - large recurrent inguinal hernia (inoperable and not readily reducible)
- oesophagostomy
- gastrostomy
- ventral hernia, not well supported.
|
20 | Any of the following: - massive ventral hernia (inoperable, with severe diastasis of recti)
- jejunostomy
- ileostomy.
|
(Percentage whole person impairment)
Introduction
These tables are intended to be used to assess impairment arising from specific joint lesions or amputations. Where the joints function normally but the use of a limb is restricted for other reasons, eg soft tissue injury, nerve injury or bony injury not involving joints, Tables 9.4 or 9.5 should be used. These Tables can be used to assess the impairment of overall limb function from any cause.
Note: either the musculo-skeletal table or Table 9.4 or 9.5 should be used—not both.
Assessment is in accordance with the range of joint movement. X-rays should not be taken solely for assessment purposes.
Table 9.1: Upper extremity
Values are for one joint only. Where more than one joint is affected, values should be combined using the combined values table (Appendix 1).
% | Description of level of impairment |
0 | X-ray changes but no loss of function of shoulder, elbow or wrist. |
5 | Any one of the following: - x-ray changes with minimal loss of function of shoulder, elbow or wrist
- ankylosis of any joint of ring and / or small finger(s)
|
10 | Any of the following: - loss of less than half normal range of movement of shoulder or elbow
- loss of half normal range of movement of wrist
- ankylosis of any joints of index and / or middle finger(s).
|
15 | Any of the following: - loss of more than half normal range of movement of wrist
- ankylosis of any joint(s) of thumb.
|
20 | Any of the following: - loss of half normal range of movement of shoulder or elbow
- ankylosis of wrist.
|
30 | Loss of more than half normal range of movement of shoulder or elbow. |
40 | Ankylosis of shoulder or elbow. |
Table 9.2: Lower extremity
(Percentage whole person impairment)
Assessment is in accordance with the range of joint movement. X-rays should not be taken solely for assessment purposes.
Where a joint has been surgically replaced assessment is in accordance with its function.
Shortening of the lower extremity by 2.5cm or more is in impairment of 5%.
For conditions not covered (such as flail joints) the assessor should have regard to the loss of function (not exceeding the maximum allowed for amputation).
Values are for one joint only. Where more than one joint is affected, values should be combined using the combined values table (Appendix 1).
% | Description of level of impairment |
0 | X-ray changes but no loss of function of hip, knee or ankle or ankylosis or lesser changes in any toes except the hallux. |
5 | Loss of less than half normal range of movement of ankle. |
10 | Any of the following: - loss of less than half normal range of movement of hip or knee
- loss of half normal range of movement of ankle
- ankylosis of hallux.
|
15 | Loss of more than half normal range of movement of ankle. |
20 | Any of the following: - Loss of half normal range of movement of hip or knee
- ankylosis of ankle.
|
30 | Loss of more than half normal range of movement of hip or knee. |
40 | Ankylosis of hip or knee. |
Table 9.3: Amputations and/or total loss of function
(Percentage whole person impairment)
Impairment relating to the loss of or injury to a finger or toe refers not only to amputation or total loss of efficient use of the whole digit, but also to partial loss of efficient use of a digit.
% | Description of level of impairment |
5 | Any of the following: - amputation of little finger
- amputation of ring finger
- total loss of movement of any joint of thumb
- amputation of terminal segment of thumb involving one third of its flexor surface without loss of distal phalanx or interphalangeal joint
- amputation of two phalanges or joints of index, middle, ring or little finger
- amputation of distal phalanx or joint of forefinger
- amputation of distal phalanx or joint of hallux.
|
10 | Any of the following: - amputation of all toes
- amputation of great toe
- amputation of middle finger
- amputation of distal phalanx or joint of thumb.
|
15 | Any of the following: - mid-metatarsal amputation
- amputation of index finger.
|
20 | Any of the following: - partial amputation of the foot (Chopart)
- amputation of the thumb.
|
30 | Any of the following: - amputation below knee, with functional stump
- amputation at ankle
- amputation of all fingers, but not thumb.
|
% | Description of level of impairment |
40 | Any of the following: - amputation above knee with functional stump
- disarticulation at knee
- Gritti Stokes amputation
- amputation below knee with short stump (7.5 cm or less below intercondylar notch)
- disarticulation at hip joint
- amputation above knee with short stump (7.5 cm or less below tuber ischii).
|
50 | Any of the following: - hemipelvectomy
- amputation of forearm distal to biceps tendon insertion
- disarticulation at wrist joint
- mid-carpal or mid-metacarpal amputation of hand.
|
60 | Any of the following: - amputation between deltoid insertion and elbow
- disarticulation at elbow
- amputation of forearm proximal to biceps tendon insertion
- disarticulation at shoulder
- amputation above deltoid insertion.
|
70 | Forequarter (upper) amputation. |
Table 9.4: Limb function—upper limb
(Percentage whole person impairment)
% | Description of level of impairment |
10 | Can use limb for self care and grasping and holding but has difficulty with digital dexterity. |
20 | Can use limb for self care but has no digital dexterity or has difficulties grasping and holding. |
30 | Retains some use of limb but has difficulty with self care. |
40 | Cannot use limb for self care. |
Table 9.5: Limb function—lower limb
(Percentage whole person impairment)
| Description of level of impairment |
10 | Can rise to standing position and walk but has difficulty with grades and steps. |
20 | Can rise to standing position and walk but has difficulty with grades, steps and distances. |
30 | Can rise to standing position and walk with difficulty but is limited to level surfaces. |
50 | Can rise to standing position and maintain it with difficulty but cannot walk. |
65 | Cannot stand or walk. |
Table 9.6: Spine
(Percentage whole person impairment)
Lesions of the sacrum and coccyx should be assessed by using the table which most appropriately reflects the functional impairment. This will usually be Table 9.5.
Lesions of the spine are often accompanied by neurological consequences. These should be assessed using Table 9.4 or 9.5 and the results combined using the combined values table (Appendix 1).
% | Description of level of impairment |
Cervical spine | Thoraco-lumbar spine |
0 | X-ray changes only. | X-ray changes only. |
5 | Minor restrictions of movement. | Minor restrictions of movement
or
crush fracture - compression of 25-50 percent. |
10 | Loss of half normal range of movement. | Loss of less than half normal range of movement or crush fracture—compression greater than 50 percent. |
15 | Loss of more than half normal range of movement. | Loss of half normal range of movement. |
20 | Complete loss of movement. | Loss of more than half normal range of movement. |
30 | | Complete loss of movement. |
Table 10.1: Upper urinary tract
(Percentage whole person impairment)
% | Description of level of impairment |
0 | Diminution of upper urinary tract function is present as evidenced by creatinine clearance of 90 litres/day or more and/or intermittent symptoms or signs of upper urinary tract dysfunction are present that do not require continuous treatment or surveillance. |
10 | Diminution of upper urinary tract function is present as evidenced by creatinine clearance of 75 to 89 litres/day and/or single kidney. |
15 | Creatinine clearance is 75 to 89 litres/day AND symptoms and signs of urinary tract dysfunction or disease necessitate continuous medical treatment. |
30 | Diminution of upper urinary tract function is present as evidenced by creatinine clearance of 60 to 74 litres/day. |
40 | Diminution of upper urinary tract function is present as evidenced by creatinine clearance of 50 to 59 litres/day. |
45 | Diminution of upper urinary tract function is present as evidenced by creatinine clearance of 50 to 59 litres/day and symptoms and signs of dysfunction or disease are incompletely controlled by surgical or continuous medical treatment. |
60 | Diminution of upper urinary tract function is present as evidenced by creatinine clearance of 40 to 49 litres/day. |
65 | Diminution of upper urinary tract function is present as evidenced by creatinine clearance of 40 to 49 litres/day and symptoms and signs of dysfunction or disease are incompletely controlled by surgical or continuous medical treatment. |
70 | Diminution of upper urinary tract function is present as evidenced by creatinine clearance of less than 40 litres/day. |
75 | Diminution of upper urinary tract function is present as evidenced by creatinine clearance of less than 40 litres/day and symptoms and signs of dysfunction or disease are incompletely controlled by surgical or continuous medical treatment. |
85 | Deterioration of renal function requiring either peritoneal dialysis or haemodialysis. |
Table 10.2: Lower urinary tract
(Percentage whole person impairment)
% | Description of level of impairment |
0 | Occasional intermittent disorder without interval problems. |
10 | Uretheral stricture or other disorder requiring intermittent therapy (for example, passage of sounds at intervals of greater than eight weeks). |
15 | Disorder requires continuous treatment or no voluntary bladder control but good reflex activity. |
25 | Urinary diversion with or without removal of the bladder or uretheral stricture or other disorder which cannot be effectively controlled, or recurs frequently, or requires more frequent passage of sounds (at intervals of less than four to eight weeks). |
30 | Intermittent dribbling incontinence. |
45 | Continuous dribbling incontinence. |
Table 11.1: Male
(Percentage whole person impairment)
This table is used to assess conditions affecting the testes, prostate, penis, seminal vesicles, spermatic cord, epididymis and scrotum
% | Description of the level of impairment |
5 | Any of the following: - symptoms and/or signs of scrotal loss or disease
- scrotal malposition
or all of the following: - symptoms and/or signs of testicular, epididymal and/or spermatic cord disease, WITH anatomical alteration
- continuous treatment not required
- no seminal or hormonal abnormalities
or all of the following: - symptoms and/or signs of prostatic and/or seminal vesicular dysfunction or disease
- anatomical alteration present
- continuous treatment not required
or - impotence in a claimant aged 65 years or more with intact sexual organs.
|
10 | Sexual function possible but varying degrees of difficulty with erection, ejaculation and/or sensation. |
% | Description of the level of impairment |
15 | Any of the following: - sexual function possible in that there is sufficient erection but no ejaculation or sensation
- testes implanted in other than scrotal position to preserve function and testicular pain or discomfort with activity
- total loss of scrotum
- impotence in a claimant aged between 40 and 64 years with intact sexual organs
or all of the following: - symptoms and/or signs of testicular, epididymal and/or spermatic cord disease, with anatomical alteration
- continuous or frequent treatment required
- detectable seminal or hormonal abnormalities
or all of the following: - frequent severe symptoms and/or signs of prostatic and/or seminal vesicular function or disease
- anatomical alteration present
- continuous treatment required.
|
20 | No sexual function possible because of any of the following: - bilateral loss of testes
- no detectable seminal or hormonal function of the testes, epididymis or spermatic cords
- ablation of prostate and/or seminal vesicles
or - impotence in a claimant aged less than 40 years with intact sexual organs.
|
Table 11.2: Female
(Percentage whole person impairment)
% | Vulva and/or vagina | Cervix and/or uterus | Fallopian tubes and/or ovaries |
10 | Symptoms and/or signs of disease or deformity not requiring continuous treatment and sexual intercourse possible and vagina adequate for childbirth. | Symptoms and/or signs of disease or deformity not requiring continuous treatment or cervical stenosis not requiring treatment or anatomical loss in post menopausal years. | Symptoms and/or signs of disease or deformity not requiring continuous treatment or unilateral dysfunction or bilateral loss in post menopausal years. |
25 | Symptoms and/or signs of disease or deformity requiring continuous treatment and sexual intercourse possible with varying degrees of difficulty and vaginal delivery limited in pre-menopausal years. | Symptoms and/or signs of disease or deformity requiring continuous treatment or cervical stenosis requiring periodic treatment. | Symptoms and/or signs of disease or deformity requiring continuous treatment but tubes are patent and ovulation is possible. |
35 | Symptoms and/or signs of disease or deformity not controlled by continuous treatment and sexual intercourse not possible and
vaginal delivery not possible in the pre-menopausal years. | Symptoms and/or signs of disease or deformity not controlled by continuous treatment or cervical stenosis complete or anatomical or complete functional loss in the pre-menopausal years. | Symptoms and/or signs of disease or deformity not controlled by continuous treatment and total loss of tubular patency, or total failure to produce ova, in the pre-menopausal years. |
Table 11.3: Mammary glands
(Percentage whole person impairment)
% | Description of level of impairment |
10 | Any of the following. - female of childbearing age with absence of the breasts
- male with painful gynaecomastia that interferes with daily activities
- galactorrhoea sufficient to require the use of absorbent pads.
|
Neurological function is divided into three sub-groups—cranial nerves (Table 12.1), communication (Tables 12.2 & 12.3) and cognitive function (Tables 12.4 & 12.5).
Communication and cognitive function are each divided into two sub-sections—the sub-sections of communication are comprehension (Table 12.2) and expression (Table 12.3); the sub-sections of cognitive function are memory (Table 12.4) and reasoning (Table 12.5).
Cranial nerves
(Percentage whole person impairment)
Please note that assessments for sight, smell and taste can be made under other tables. They have been included here as well so that this table is complete. Do not make two separate assessments and combine them. Use one or the other. The other relevant tables are Table 6.1 ‘Visual system’, and Table 7.2 ‘Ear, nose and throat disorders—Miscellaneous’.
Table 12.1
% | Criteria |
Unilateral loss or paralysis | Bilateral loss or paralysis | Other |
0 | I
XII | I | |
5 | V (motor) | VII (complete loss of taste). | |
10 | V (sensory) | XII (swallowing impairment, with diet restricted to semi-solids). | Swallowing impairment due to one or two combinations of IX, X and XI, with diet restricted to semi-solids. |
15 | VII | | |
20 | | | VII Atypical facial neuralgia. |
25 | II
or
III, IV, VI alone or in combination (diplopia corrected by covering one eye. | | |
30 | | XII (swallowing impairment, with diet restricted to liquids). | Swallowing impairment due to one or two combinations of IX, X and XI, with diet restricted to liquids. |
35 | | V (sensory) | |
45 | | V (motor) | |
50 | | | V Intractable typical trigeminal neuralgia or tic douloureux. |
60 | | XII (swallowing impairment, with diet by tube feeding or gastrostomy. | Swallowing impairment due to one or two combinations of IX, X & XI, and resulting in diet by tube feeding or gastrostomy. |
85 | | II | |
Tables 12.2 to 12.5 should not be used to assess problems whose origins are genetic, social or educational. Their use is confined to the assessment of the consequences of neurological injury or disease.
Communication
Notes:
Communication disorders may arise as a result of interference with comprehension and/or expression. They are the result of neurological damage arising for example from head injury or cerebro-vascular accident. Comprehension may be further divided into hearing and reading skills and expression into verbal and written skills. A report from a Speech Pathologist or Rehabilitation Specialist will generally be necessary to enable impairment of this function to be accurately assessed. In all cases the employee’s abilities prior to the injury or disease must be taken into account. It would be inappropriate to assess an illiterate person with respect to reading and writing skills. Similarly where English is an employee’s second language, it may be more appropriate to base assessment on interference with ability to understand and speak the employee’s first language.
Table 12.2: Comprehension
(Percentage whole person impairment)
% | Criteria |
| Hearing* | Reading |
5 | Understands speech in most situations, but has difficulties in groups or when fatigued. | Reads books and magazine articles, but does not understand details. |
10 | Understands speech in one to one situations, but cannot cope in group situations. | Can get the gist of simple articles, for example in newspapers, but has great difficulty with details. |
20 | | Understands only simple sentences. |
25 | Understands simple sentences although repetition is sometimes needed. | |
30 | | Able to read only single words. |
35 | | Unable to read at all. |
40 | Able to understand only single words. | |
50 | Unable to understand any language. | |
Notes:
*Hearing refers to the ability to comprehend spoken language—i.e. with the ability to interpret auditory signals, not to receive such signals. It does not refer to hearing impairment which is assessed using Table 8.1
Table 12.3: Expression
(Percentage whole person impairment)
% | Criteria |
Verbal | Written |
5 | Can sustain conversation, but has minor word retrieval problems and/or hesitancy. | Can write simple letters, but cannot write complex documents. |
10 | Can converse in simple sentences only and may have difficulty with word finding and expressing complex ideas. | Can write postcards and letters of about five lines (spelling and grammatical errors may be apparent), but cannot write longer documents. |
15 | | Can write only short, simple sentences (spelling errors may be evident). |
20 | Only able to respond in short sentences or phrases. | Cannot write sentences, but can write single words. |
25 | | Able to write or copy only a familiar sequence of letters, for example own name
or
unable to write at all. |
30 | Limited to use of single words and/or social or stereotyped phrases. | |
35 | No useful speech (includes unintelligible speech and speech limited to swearing). | |
Table 12.4: Memory
(Percentage whole person impairment)
% | Criteria |
0 | No appreciable effect. Reliance on notes, lists etc is comparable to others of same age, education and lifestyle. |
10 | Difficulties with names and appointments and tends to misplace objects.
There may be partial compensation by reliance on notes, lists, diaries or other people. |
25 | Failure to keep appointments or fulfil other obligations despite use of memory aids and
difficulties recalling details of recent events AND tendency to get lost in unfamiliar surroundings. |
40 | Failure to keep appointments or fulfil other obligations despite use of memory aids, to a more pronounced extent
and
some supervision by another necessary.
|
60 | Unable to recall recent events or experiences and constant supervision necessary to avoid harm, resulting in inability to live independently. |
70 | Unable to recall recent events or experiences, to a more pronounced extent and
disorientation in familiar surroundings and
inability to recognise familiar faces or objects. |
Notes:
Cognitive function has two components—memory and reasoning ability. These functions are affected where there is neurological damage eg, from head injury, cerebro-vascular accident etc. Difficulties with memory or reasoning ability due to some other process eg, psychiatric illness should not be assessed using these tables. Instead Table 6.1 should be used.
Assessment should be carried out by a neurologist or clinical psychologist.
Table 12.5: Reasoning
(Percentage whole person impairment)
% | Criteria |
0 | Abilities intact. |
10 | Able to cope with routine activities and situations but experiences minor difficulties in new situations. |
25 | Still able to cope with routine activities but has moderate difficulties in new
situations and
Complex decision making and abstract thinking are affected. |
40 | Major difficulties in new situations and
difficulties with routine activities and problems becoming manifest and
complex decision making and abstract thinking seriously affected. |
60 | Major difficulties in carrying out routine daily activities.
Perseverative thinking may be evident. |
70 | Needs prompting and assistance with even the simplest activities. |
Notes:
Assessment is carried out by examining the degree of interference with the ability to plan and carry out tasks involving a number of steps, ability to solve problems and make decisions which involve the examination of new and old material, ability to think in abstract terms eg, interpret proverbs. Generally complex tasks and decisions will be first affected as will decisions involving unfamiliar factors.
Assessment should be carried out by a neurologist or clinical psychologist.
Table 13.1: Intermittent conditions
(Percentage whole person impairment)
For use in the assessment of disorders of the haemopoietic system such as anaemia, polycythaemia, leucocyte and platelet disorders and intermittent disorders such as asthma, migraine, tension headache, epilepsy etc.
Principles:
Determine the frequency, duration and severity of attacks with reference to the degree of interference with activities of daily living.
% | Description of level of impairment |
0 | Episodes may be of any frequency but do not interfere with activities of daily living
or are readily prevented or reversed by appropriate medication or treatment. |
10 | Episodes occur 12 or more times a year and cause minor interference with activities of daily living or
episodes occur less frequently and cause interference with all activities of daily living other than self care. |
20 | Episodes occur up to 25 percent of the time and cause significant interference with most activities of daily living other than self care. |
30 | Episodes occur up to 30 percent of the time and cause significant interference with most activities of daily living other than self care. |
40 | Episodes occur up to 40 percent of the time and cause significant interference with most activities of daily living other than self care. |
50 | Episodes occurup to 50 percent of the time and cause significant interference with most activities of daily living other than self care. |
60 | Episodes occur up to 60 percent of the time and cause significant interference with most activities of daily living other than self care. |
70 | Episodes occur up to 70 percent of the time and cause significant interference with most activities of daily living other than self care. |
75-95 | Episodes occur 75 to 100 percent of the time and needs assistance with most or all activities of daily living including self care (confinement to a residential care facility is required for assessed impairment levels of more than 80 percent). |
Notes:
Assessors should refer to the Principles of Assessment for guidance on awarding an impairment value within a range.
Table 13.2: Malignancies
(Percentage whole person impairment)
% | Description of level of impairment |
0 | No symptoms or evidence of disease and able to undertake normal activities with no special care needed. |
10-15 | Some signs or symptoms of disease and normal activities can be undertaken with moderate effort. |
35 | Does not require institutional care but needs assistance with activities of daily living other than self care. |
50 | Can still be maintained at home but with considerable assistance and frequent medical care. |
65 | Requires institutional care and considerable assistance with activities of daily living other than self care. |
75 | Requires institutional care and considerable assistance with activities of daily living including self care. |
85 | Intensive support and/or treatment needed (disease may be progressing rapidly). |
Notes:
Assessors should refer to the Principles of Assessment for guidance on awarding an impairment value within a range.
The values are derived from the formula:
A + B(1-A) = combined value of A and B
where A and B are the decimal equivalents of the WPI ratings
In the chart all values are expressed as percentages. To combine any two impairment values, locate the larger of the values on the side of the chart and read along that row until you come to the column indicated by the smaller value at the bottom of the chart. At the intersection of the row and the column is the combined value.
For example, to combine 35% and 20%, read down the side of the chart until you come to the larger value, 35%. Then read across the 35% row until you come to the column indicated by 20% at the bottom of the chart. At the intersection of the row and column is the number 48. Therefore, 35% combined with 20% is 48%. Because of the construction of this chart, the larger impairment value must be identified at the side of the chart.
If three or more impairment values are to be combined, sort the impairment values from highest to lowest, select the highest and second highest, then find their combined values as above. Then use that combined value and the third highest impairment value to locate the combined value of all impairments.
This process can be repeated indefinitely, the final value in each instance being the combination of all the previous values. In each step of this process the larger impairment value must be identified at the side of the chart.
Introduction
The degree of non-economic loss is to be assessed in accordance with this part.
The compensation payable for non-economic loss is divided into two equal amounts. The formula to calculate the total payable in an individual case is:
$ Total = A + B
WHERE A = the percentage assessment of total permanent impairment, multiplied by the first half of the maximum
AND B = a reasonable percentage of the second half of the maximum, having regard to the non-economic loss suffered.
To calculate B, the following tables in this part are used:
Table 1: Pain and suffering
Table 2: Loss of amenities
Table 3: Other loss
Table 4: Loss of expectation of life
Table 5: Combined value calculation
Table 6: Final calculation.
Table 1: pain and suffering
Only permanent pain and suffering is considered. Suffering is the mental distress as a result of the accepted conditions (it includes emotional symptoms such as grief, anguish, fear, frustration, humiliation, embarrassment etc).
This table does not include temporary pain and suffering. Nor does it include speculation of future pain and suffering that has not yet manifested itself.
A score out of five is assessed for both pain and for suffering. These two scores are then combined with the scores derived from Tables 2, 3 and 4 using the combined value calculation (Table 5).
Pain |
Score | Description of level of effect |
0 | No pain experienced. |
1 | Intermittent attacks of pain of nuisance value only. Can be ignored when activity commences. |
2 | Intermittent attacks of pain. Not easily tolerated, but short lived. Responding fairly readily to treatment. |
3 | Episodes of pain more persistent. Not easily tolerated. Treatment, if available, of limited benefit. |
4 | Pain occurring most of the time. Restrictions on activity. Resistant to treatment. |
5 | Pain continuous and severe preventing activity. Not controlled by medication. |
Suffering |
Score | Description of effect |
0 | No symptoms experienced. |
1 | Symptoms minimal or ill defined. Occur intermittently. No interference with activity. |
2 | Distinct symptoms. Episodic in nature. Activities reduced during such episodes. Recovers quickly after episodes. |
3 | Symptoms distinct and varied. Episodes occur regularly. Ability to cope or perform activity effectively reduced during episodes. Needs time to recover between episodes. Treatment of benefit. |
4 | Symptoms wide ranging. Tend to dominate thinking. Little time when free of symptoms. Difficulty coping or performing activity. Treatment necessary. |
5 | Constantly focussed on condition. Ruled by emotions. Symptoms interfere with normal thought processes. Unable to cope. Activities severely restricted. Treatment of no real help. |
Table 2: loss of amenities
Loss of amenities is also known as loss of enjoyment of life.
A score out of five is assessed for each of the following:
- mobility
- social relationships
- recreation and leisure activities.
These are then combined with the scores from Tables 1, 3 and 4 using the combined value calculation (Table 5).
Mobility
Concerns the employee’s ability to move around in his or her environment
Score | Description of effect |
0 | No or minimal restrictions on mobility. |
1 | Effects on mobility periodic or intermittent—in between episodes no restrictions. Effects continuing but mild (eg slowing of pace, need for a walking stick) (can do everything, but at a slower pace). |
2 | Mobility reduced, but remains independent of others both within and outside the home. Can travel but may need to have rest breaks, special seating or other special treatment |
3 | Mobility markedly reduced. Needs some assistance from others. Unable to use most forms of transport.
|
4 | Restricted to home and vicinity. Can only travel with door to door transport. Needs assistance of others. |
5 | Severely restricted mobility (eg bed, chair, room). Dependent on others for assistance. Mechanical devices or appliances used (eg wheelchair, hoist). |
Social relationships
Concerns the employee’s capacity to engage in usual social and personal relationships.
Score | Description of effect |
0 | Usual relationships unaffected. |
1 | Minor interference with personal relationships, causing some reduction in social activities and contacts. |
2 | Relationships confined to immediate and extended family and close friends, but unable to relate to casual acquaintances. |
3 | Difficulty in maintaining relationships with close friends and the extended family. |
4 | Social contacts confined to immediate family. |
5 | Difficulty relating socially to anyone. |
Recreation and leisure activities
Concerns the employee’s ability to maintain customary recreational and leisure pursuits
Score | Description of effect |
0 | Able to follow usual recreation and leisure activities. |
1 | Intermittent interference with activities. In between episodes able to pursue usual activities. |
2 | Interference with activities reduces frequency of activity, but is able to continue. Is able to enjoy alternatives. |
3 | Unable to continue activity. Alternative less satisfying activity possible. |
4 | Range of activities greatly reduced. Needs some assistance to participate. |
5 | Unable to undertake any satisfying or rewarding activities. |
Table 3: Other loss
This table is used to assess losses of a non-economic nature that are not adequately covered by Table 1, 2 or 4.
A score out of 3 is assessed. This is then combined with the scores derived from Tables 1, 2 and 4. using the combined value calculation (Table 5).
The factors to be considered include:
- dependence upon external life saving or supporting machine (for example, aspirator, respirator, dialysis machine, or any form of electro-mechanical device for the sustenance or extension of activities)
- dependence upon a specialised diet
- detrimental effects of climatic features (for example, temperature, humidity, ultra-violet rays, light, noise, dust)
- move to specially modified premises.
Score | Description of effect |
0 | Nil or minimal disadvantages |
1 | Slight disadvantages |
2 | Moderate disadvantages |
3 | Marked disadvantages |
Table 4: Loss of expectation of life
A score out of three is assessed. This is then combined with the scores derived from Tables 1, 2 and 3. using the combined value calculation (Table 5). Loss of expectation of life is restricted to a maximum of three points because of the value placed on it by the courts in damages cases.
Score | Description of effect of effect |
0 | Loss of life expectancy of less than one year. |
1 | Loss of life expectancy of 1 year to less than 10 years. |
2 | Loss of life expectancy of 10 years to less than 20 years. |
3 | Loss of life expectancy of 20 years or more. |
Table 5: Combined value calculation
This table converts the total of the scores (assessed in Tables 1, 2, 3 and 4) to a percentage of the second half of the maximum lump sum payable for non-economic loss.
Calculation of total of scores
Table 1: Pain and suffering
(Pain score ____) x 0.5 = ____
(Suffering score ____) x 0.5 = ____
Table 2: Amenities of life
(Mobility score ____) x 0.6 = ____
Social relationships score ____) x 0.6 = ____
(Recreation and leisure activities score ____) x 0.6 = ____
Table 3: Other loss
(Score ____) x 1.0 = ____
Table 4: Loss of expectation of life
(Score ____) x 1.0 = ____
Total of scores = ____
Conversion of total of scores to a percentage
A. If the combined total of scores from Tables 1, 2, 3 and 4 equals or is greater than 15, then 100 percent of the second half of the maximum is payable
or
B. If the combined total of scores from Tables 1, 2, 3 and 4 is less than 15, then the percentage of the second half of the maximum that is payable is calculated using the following formula:
(total of scores) | x 100 |
15 |
Table 6: Final calculation
(benefit levels as from 1 July 2011)*
(1) | Whole person impairment
(as per Permanent impairment questionnaire) | |
| | ____ % x $163,535.42 | $__________ |
| | | |
(2) | First half of $30,662.91 | ____ % x $30,662.91 | $__________ |
| | | |
(3) | Second half of $30,662.91 (as per non-economic
loss questionnaire)
| | |
| Table 1: Pain and suffering | | |
| Pain score | ____ | |
| Suffering score | ____ | |
| Subtotal of scores | ____ x 0.5 = ____ | |
| | | |
| Table 2: Amenities of life | | |
| Mobility score | ____ | |
| Social relationships score | ____ | |
| Recreation and leisure
Activities score | ____ | |
| | | |
| Subtotal of scores | ____ x 0.6 = ____ | |
| | | |
| Table 3: Other loss | | |
| Other loss score | ____ x 1.0 = ____ | |
| | | |
| Table 4: Loss of expectation of life | | |
| Loss of expectation score | ____ x 1.0 = ____ | |
| | | |
| Total of scores | | |
| | | |
| If Score > 15: pay maximum $30,662.91
If Score < 15: calculate % of $30,662.91
using following formula: | |
| (total of scores) | x 100 | 15 |
| $__________ | |
| Total | $__________ | |
*These are indexed annually on 1 July in accordance with CPI. Check with Comcare for the latest rates if unsure.